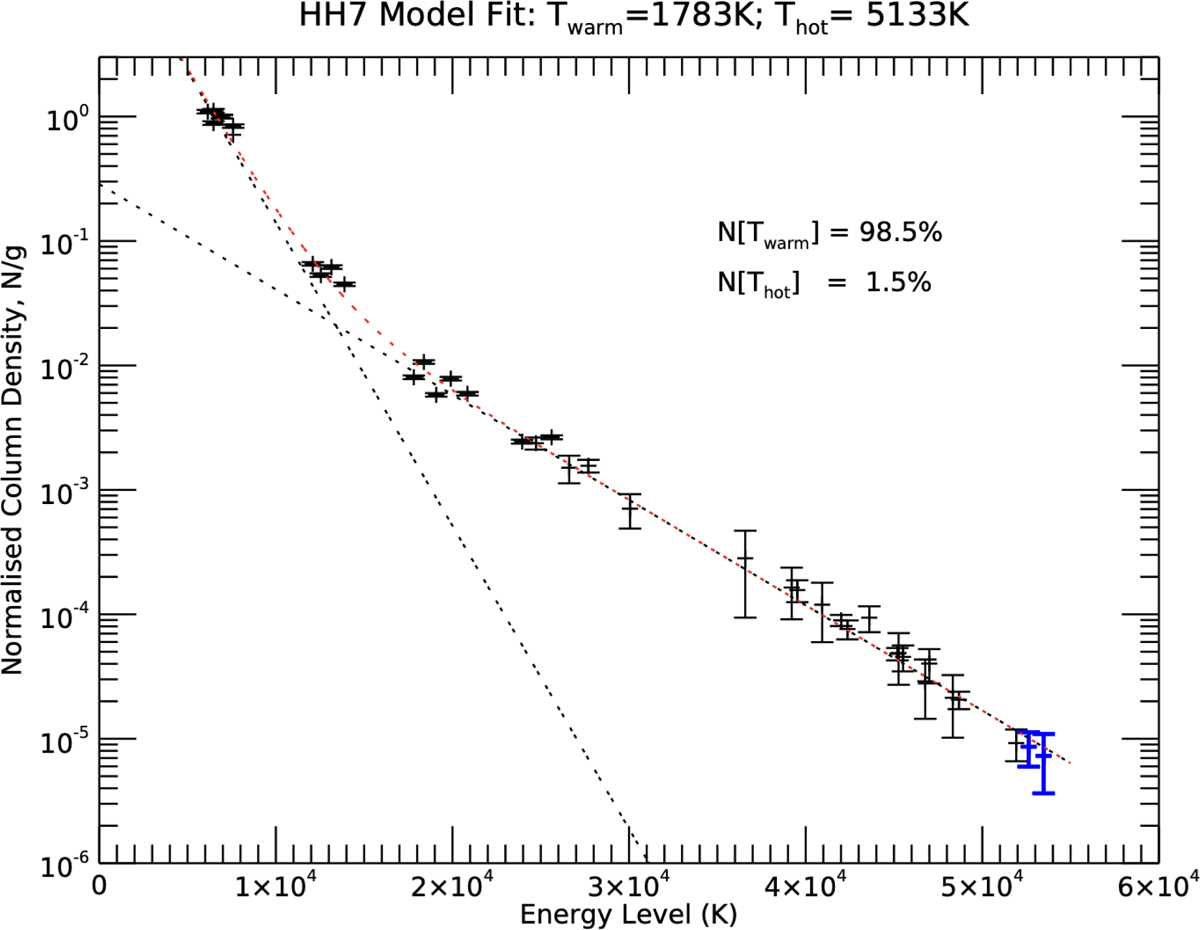
Fig. 3.
Download original image
Level column densities, divided by their degeneracies, Ni/gi, plotted as a function of level energy, Ti, for the H2 lines measured in HH7. They are normalised to unity for the (v, J)=(1, 3) upper-state level at 6952 K, which emits the 1–0 S(1) line. The two blue points (in the lower right) are for the newly analysed 2–1 S(27) and 1–0 S(29) lines. The dashed red line shows the best two-temperature LTE fit, as described in Sect. 4.
Current usage metrics show cumulative count of Article Views (full-text article views including HTML views, PDF and ePub downloads, according to the available data) and Abstracts Views on Vision4Press platform.
Data correspond to usage on the plateform after 2015. The current usage metrics is available 48-96 hours after online publication and is updated daily on week days.
Initial download of the metrics may take a while.