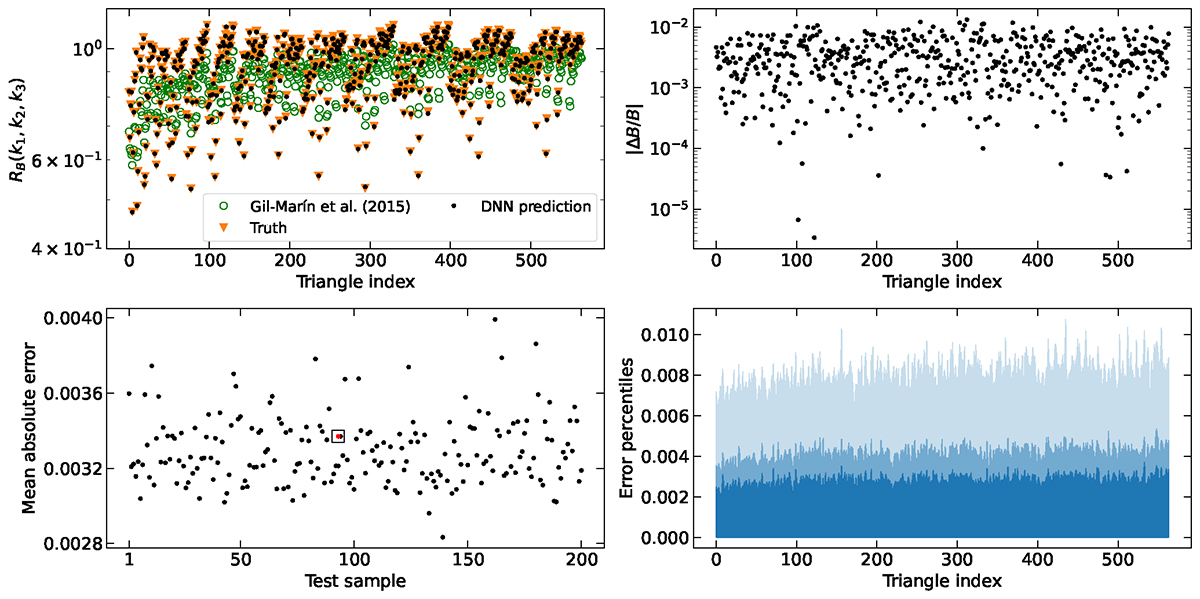
Fig. 3.
Download original image
As in Fig. 3, but for the bispectrum. The triangular configurations in the top and bottom right panels satisfy the constraint k1 ≥ k2 ≥ k3 and are ordered so that first k3 increases (at fixed k1 and k2), then k2 (at fixed k1), and finally k1. For reference, in the top left panel, the ratio RB(k1, k2, k3) is also plotted, computed according to the approximated method introduced by Gil-Marín et al. (2015; green circles).
Current usage metrics show cumulative count of Article Views (full-text article views including HTML views, PDF and ePub downloads, according to the available data) and Abstracts Views on Vision4Press platform.
Data correspond to usage on the plateform after 2015. The current usage metrics is available 48-96 hours after online publication and is updated daily on week days.
Initial download of the metrics may take a while.