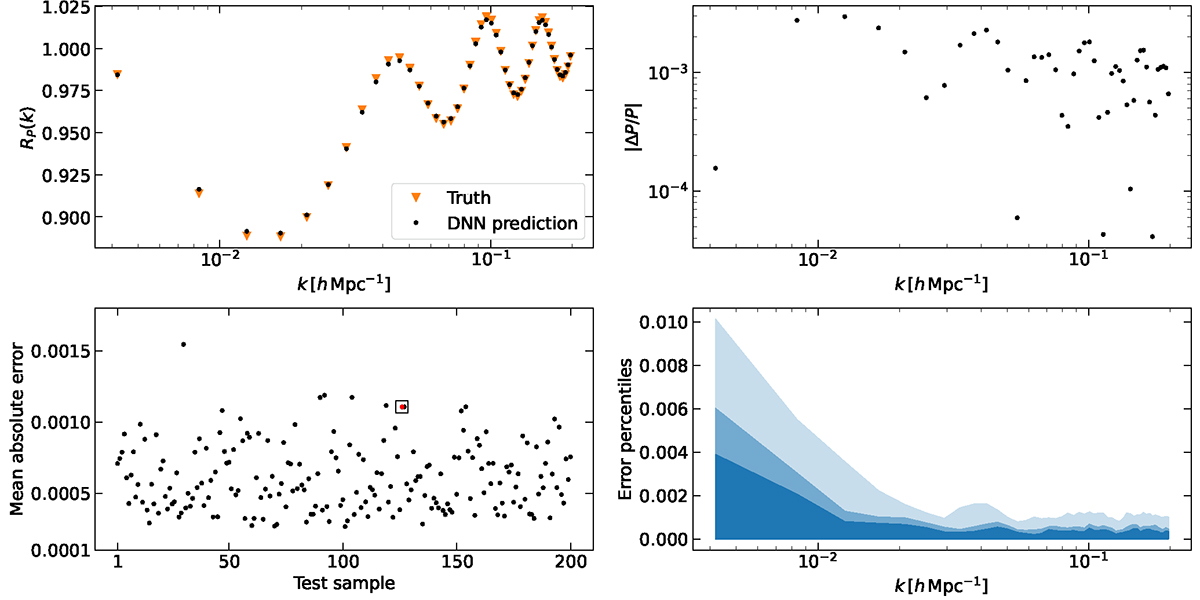
Fig. 2.
Download original image
Accuracy of the trained DNN for the power spectrum convolution. Top left: function RP(k) obtained with the convolution integral in Eq. (1) (orange triangles) compared with the DNN model (black dots) for one test sample. Top right: relative error of the DNN model in the same test sample used in the left panel. Bottom left: MAEs for all the test samples (the one used in the top panels is highlighted in red and surrounded by a square). Bottom right: 50th, 68th, and 95th error percentiles of the DNN model as a function of k. Generally, the DNN model yields sub-per cent accuracy.
Current usage metrics show cumulative count of Article Views (full-text article views including HTML views, PDF and ePub downloads, according to the available data) and Abstracts Views on Vision4Press platform.
Data correspond to usage on the plateform after 2015. The current usage metrics is available 48-96 hours after online publication and is updated daily on week days.
Initial download of the metrics may take a while.