Fig. 3.
Download original image
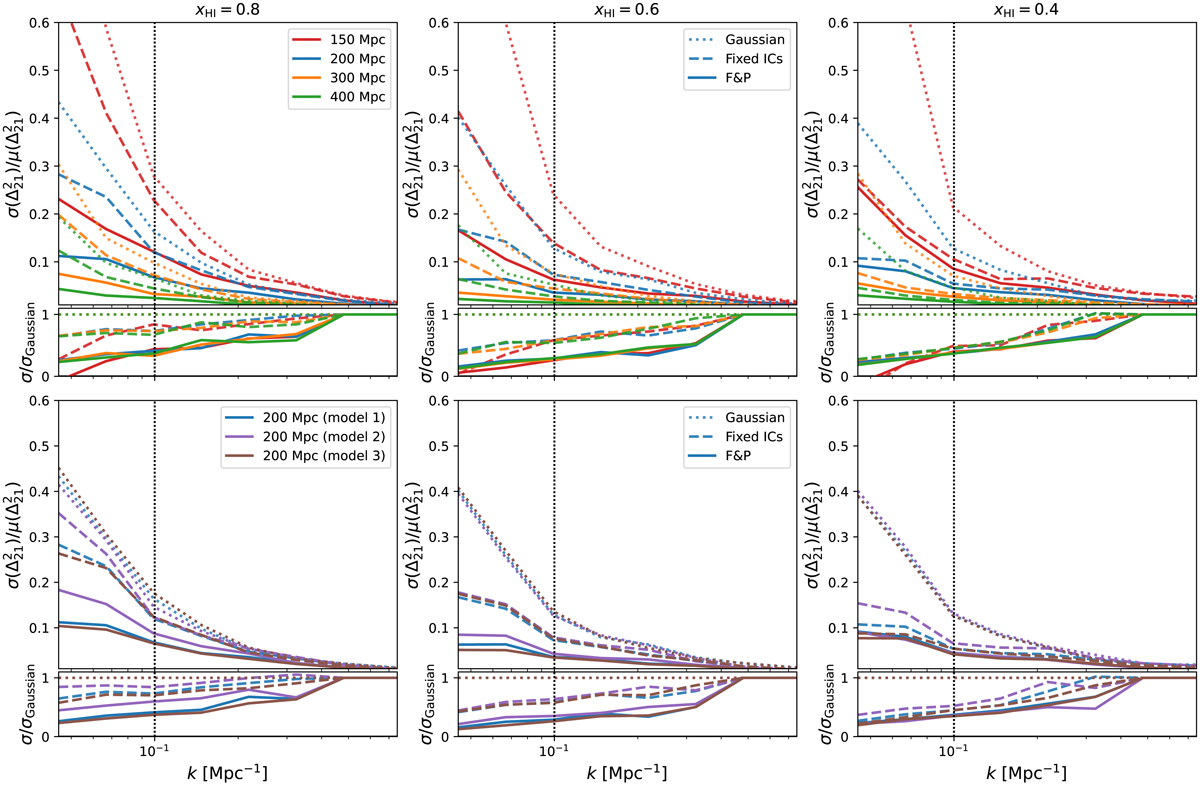
Ratio of standard deviation on the power spectra to the mean power spectra estimated from 100 simulations at early (left panels), middle (middle panels), and late (right panels) stages of reionization. We also mark the wave mode k = 0.1 Mpc−1 with vertical lines. The top panels show the results from four different simulation volumes (150 Mpc: red, 200 Mpc: blue, 300 Mpc: orange, 400 Mpc: green) for the Gaussian (dotted), fixed IC (dashed), and F&P (solid) methods. We see that the fixed IC and F&P methods reduce the error on the power spectra by about 1.5 and 2 times, respectively, compared to the Gaussian method. The bottom panels show the results for three different reionization models (1: blue, 2: violet, 3: brown). Both the fixed IC and F&P methods work in a similar manner for all the models. We have also included, in the bottom sub-panels, the ratio of standard deviation to that of the Gaussian method.
Current usage metrics show cumulative count of Article Views (full-text article views including HTML views, PDF and ePub downloads, according to the available data) and Abstracts Views on Vision4Press platform.
Data correspond to usage on the plateform after 2015. The current usage metrics is available 48-96 hours after online publication and is updated daily on week days.
Initial download of the metrics may take a while.