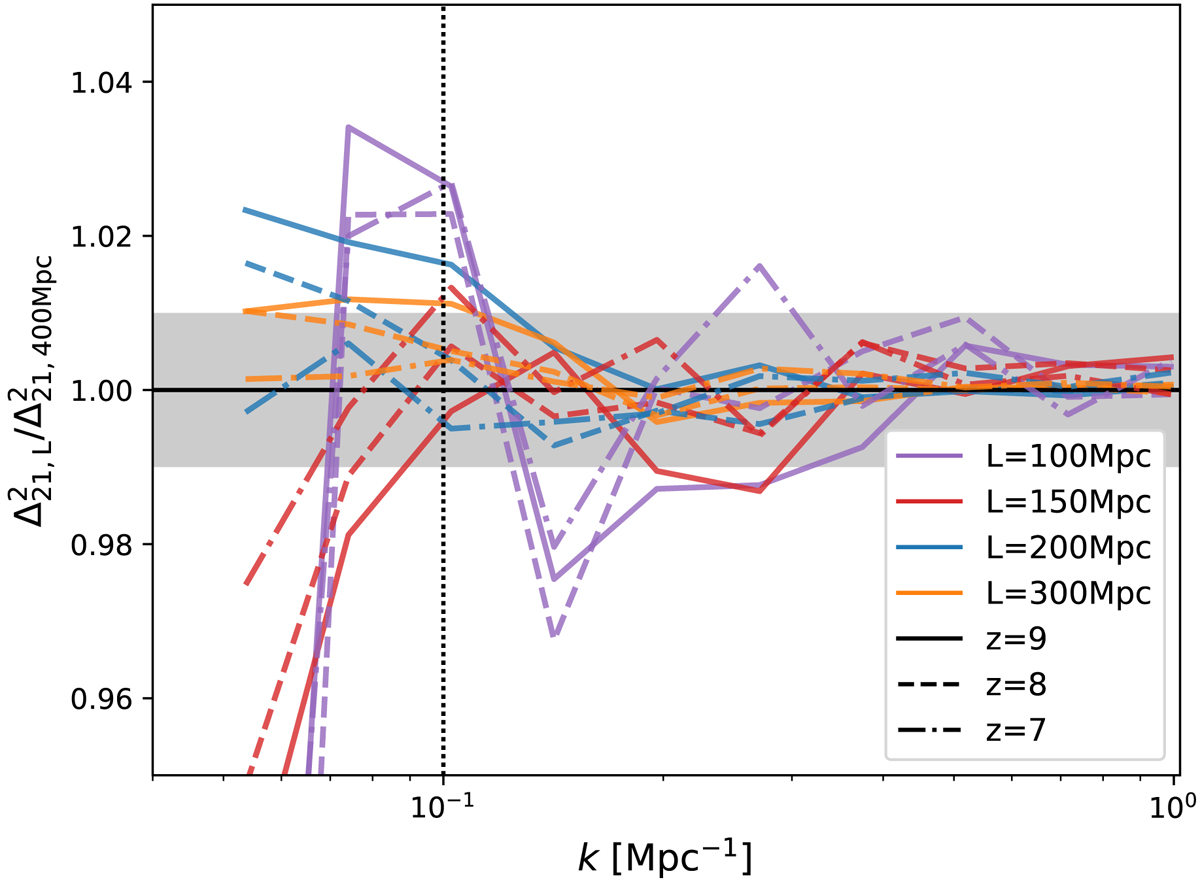
Fig. 2.
Download original image
Ratio of the power spectra produced with small simulation volumes (L = 100, 150, 200, and 300 Mpc) to that with the largest simulated volume (L = 400 Mpc). We mark k = 0.1 Mpc−1 with a vertical line, and the 1% level is the grey shaded region. The differences at k ≳ 0.1 Mpc−1 are within the 1% level for simulations with L ≳ 150 Mpc.
Current usage metrics show cumulative count of Article Views (full-text article views including HTML views, PDF and ePub downloads, according to the available data) and Abstracts Views on Vision4Press platform.
Data correspond to usage on the plateform after 2015. The current usage metrics is available 48-96 hours after online publication and is updated daily on week days.
Initial download of the metrics may take a while.