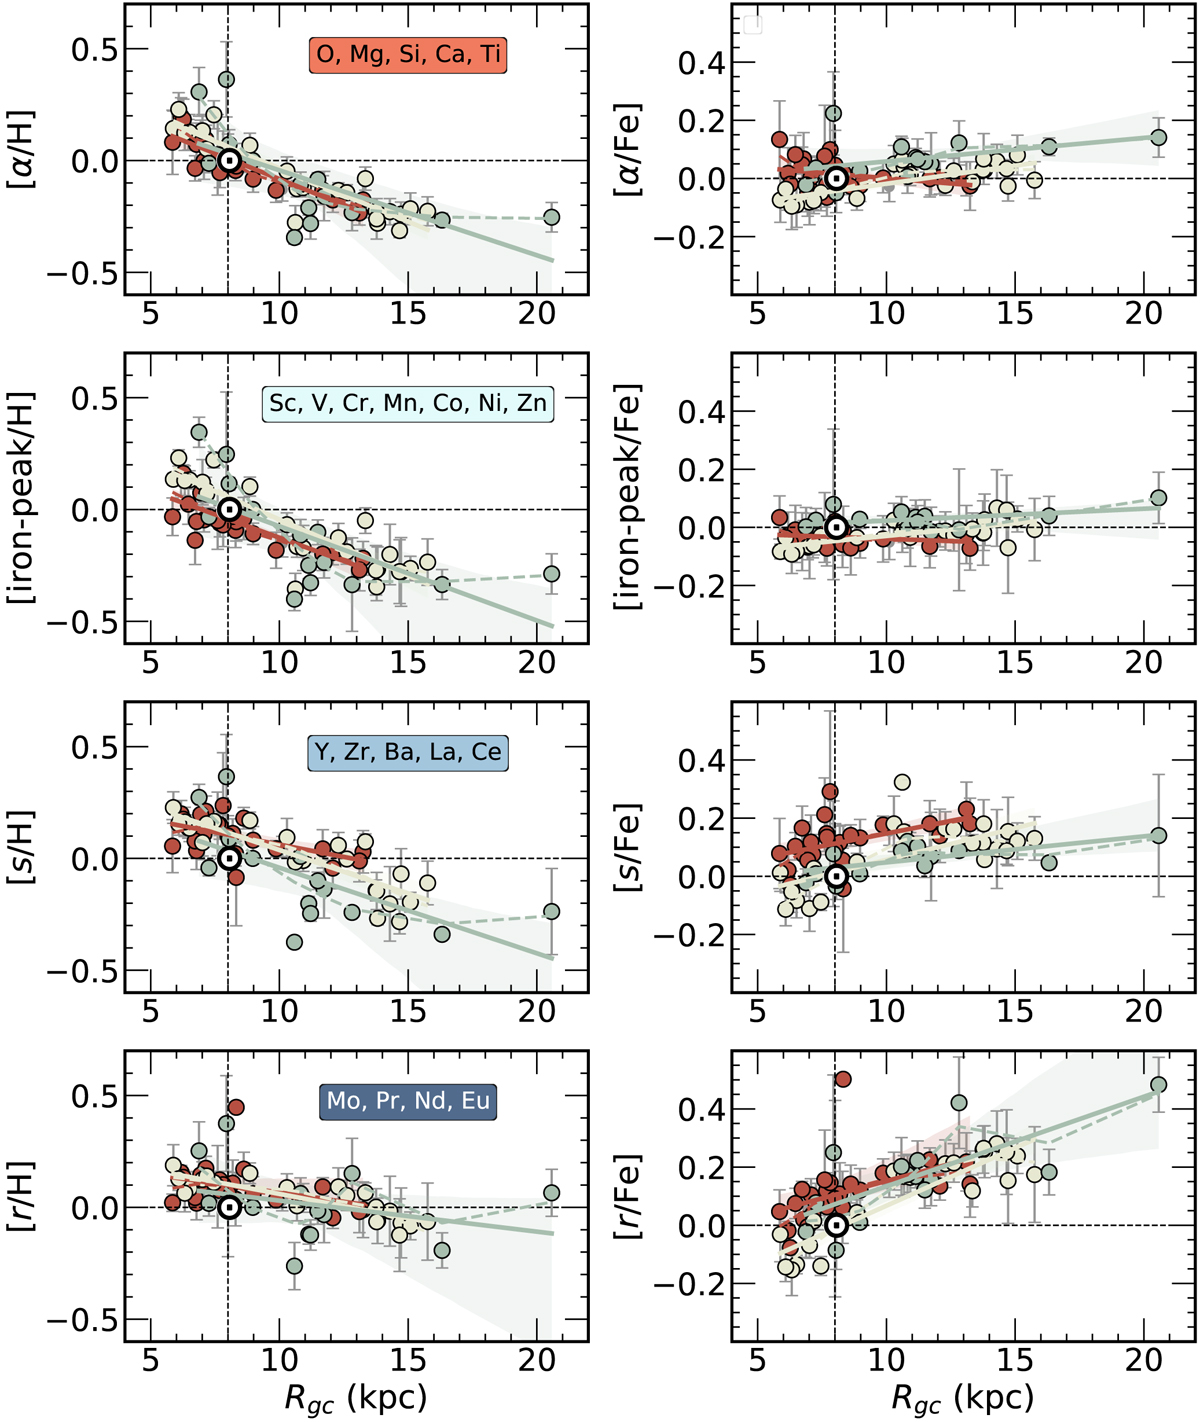
Fig. 6.
Download original image
Radial elemental gradients showing average abundances for elements belonging to four nucleosynthesis channels as a function of RGC. The lines are the linear regression model fit in every age bin, and the translucent bands around the regression lines show the confidence interval for the regression estimate. The dashed curves are the lowess models. The symbols and curves are colour-coded by cluster age as in Fig. 5.
Current usage metrics show cumulative count of Article Views (full-text article views including HTML views, PDF and ePub downloads, according to the available data) and Abstracts Views on Vision4Press platform.
Data correspond to usage on the plateform after 2015. The current usage metrics is available 48-96 hours after online publication and is updated daily on week days.
Initial download of the metrics may take a while.