Open Access
Fig. 5.
Download original image
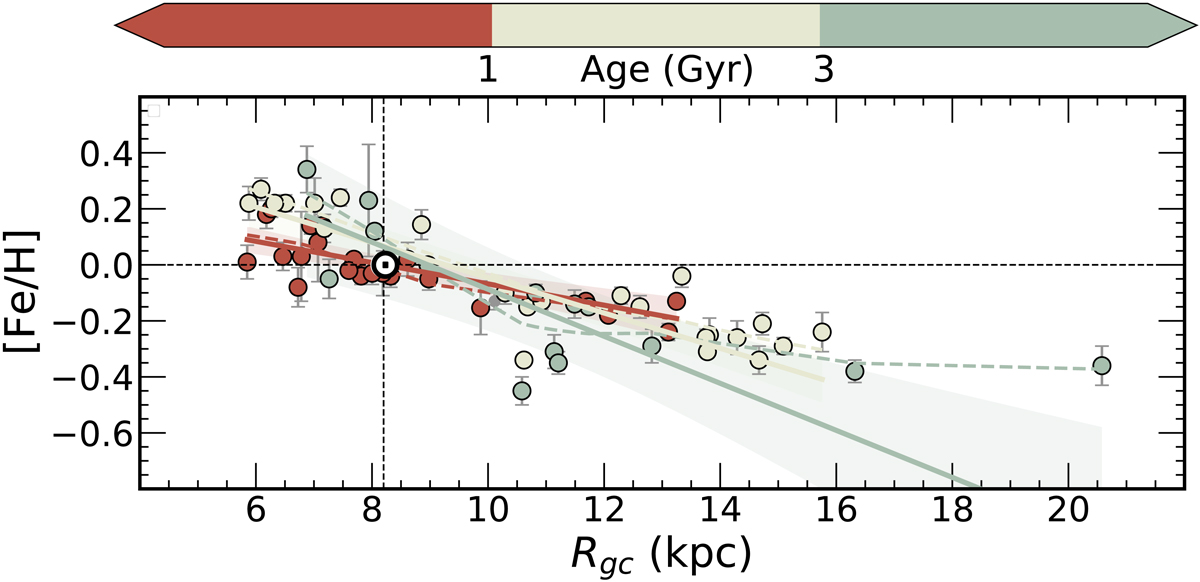
Time evolution of radial [Fe/H] gradient. The circles are colour-coded by cluster ages. The three solid lines are the weighted linear regressions and the dashed curves are lowess models for the three age bins: age < 1 Gyr (red), 1 Gyr ≤ age < 3 Gyr (beige), and age ≥ 3 Gyr (green).
Current usage metrics show cumulative count of Article Views (full-text article views including HTML views, PDF and ePub downloads, according to the available data) and Abstracts Views on Vision4Press platform.
Data correspond to usage on the plateform after 2015. The current usage metrics is available 48-96 hours after online publication and is updated daily on week days.
Initial download of the metrics may take a while.