Fig. 3.
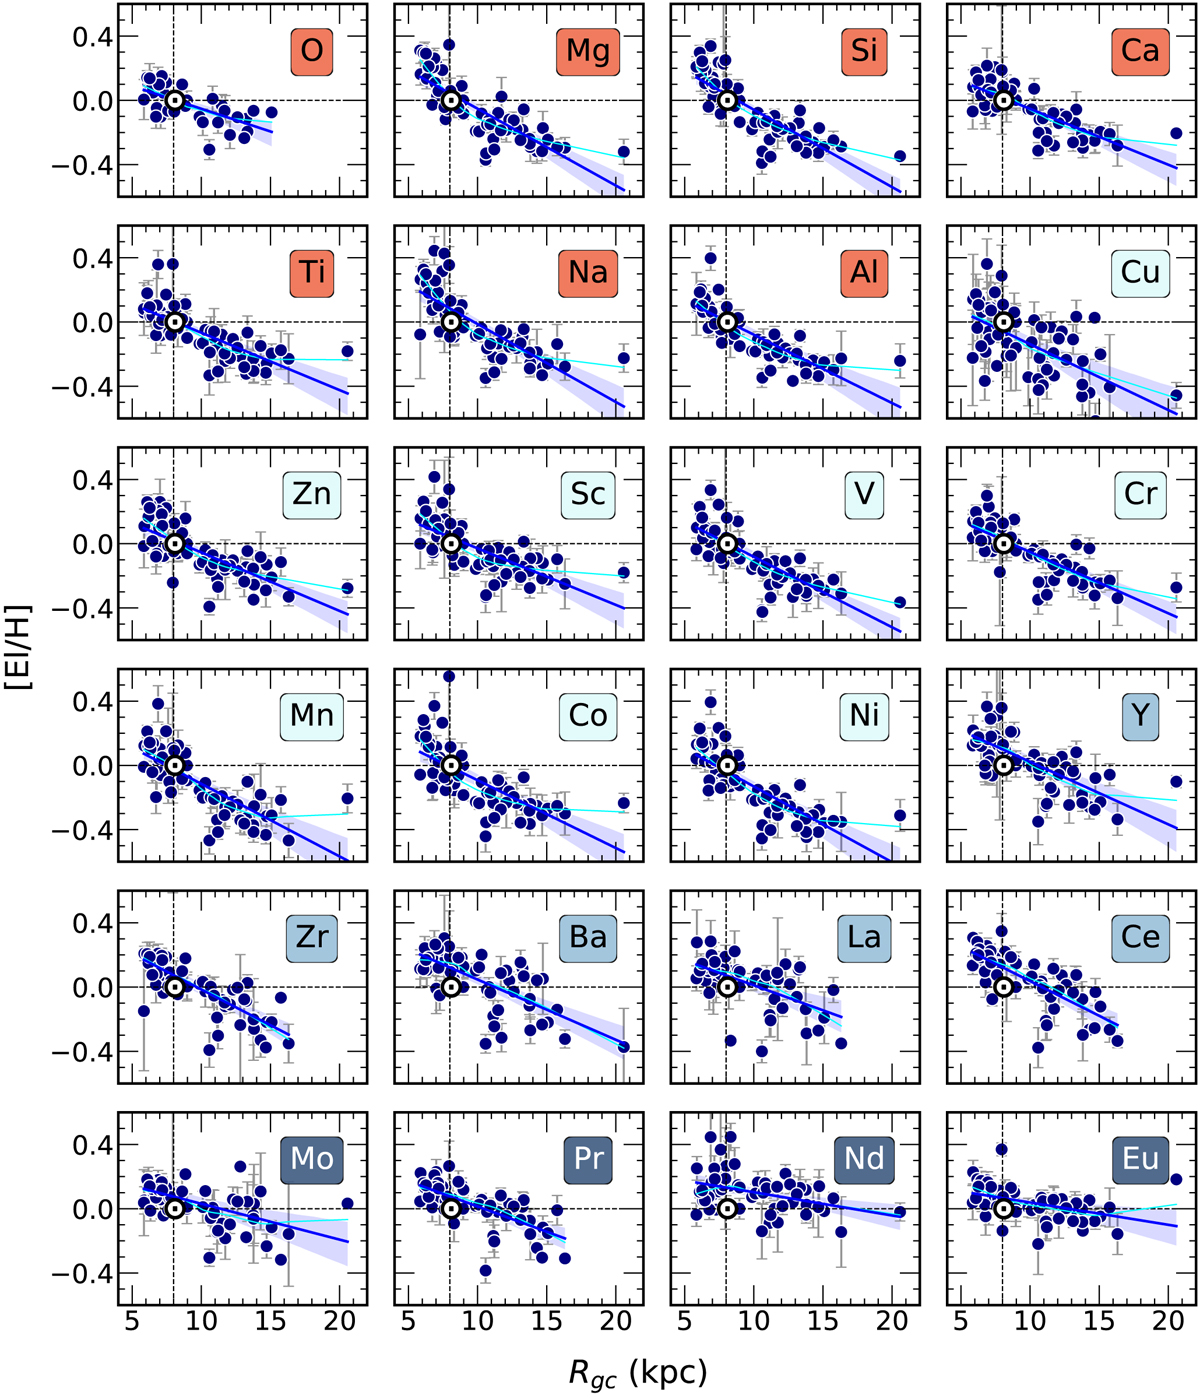
Download original image
Radial elemental gradients [El/H] as a function of RGC. The blue lines are linear regression model fits, the translucent bands around the regression lines describe a 95% bootstrap confidence interval, and the cyan curves are the lowess models. Each panel is colour-coded according to the nucleosynthesis channel (red: α and odd-Z elements; light cyan: iron-peak elements; cyan: s-process elements; dark cyan: r-process elements).
Current usage metrics show cumulative count of Article Views (full-text article views including HTML views, PDF and ePub downloads, according to the available data) and Abstracts Views on Vision4Press platform.
Data correspond to usage on the plateform after 2015. The current usage metrics is available 48-96 hours after online publication and is updated daily on week days.
Initial download of the metrics may take a while.