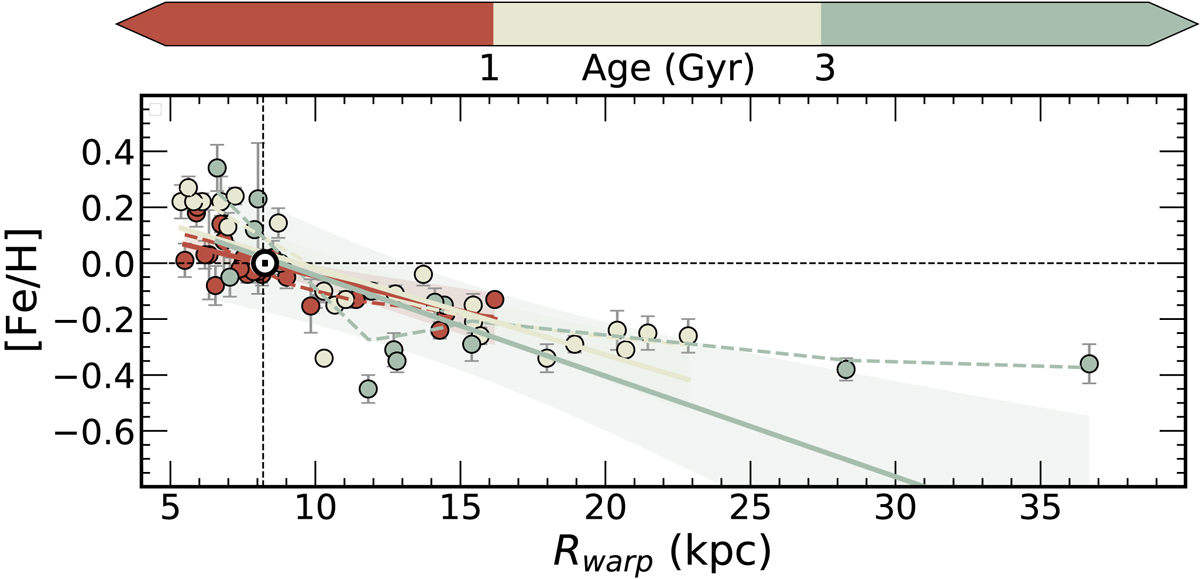
Fig. 13.
Download original image
Radial [Fe/H] gradients with all the sample clusters, colour-coded by the three age bins (one-slope linear weighted regressions, with the confidence levels indicated by the shaded areas). Their RGC are corrected for the time-dependent warp, as in Amôres et al. (2017). The dashed lines are the lowess fits. The symbols and curves are colour-coded by cluster age as in Fig. 5.
Current usage metrics show cumulative count of Article Views (full-text article views including HTML views, PDF and ePub downloads, according to the available data) and Abstracts Views on Vision4Press platform.
Data correspond to usage on the plateform after 2015. The current usage metrics is available 48-96 hours after online publication and is updated daily on week days.
Initial download of the metrics may take a while.