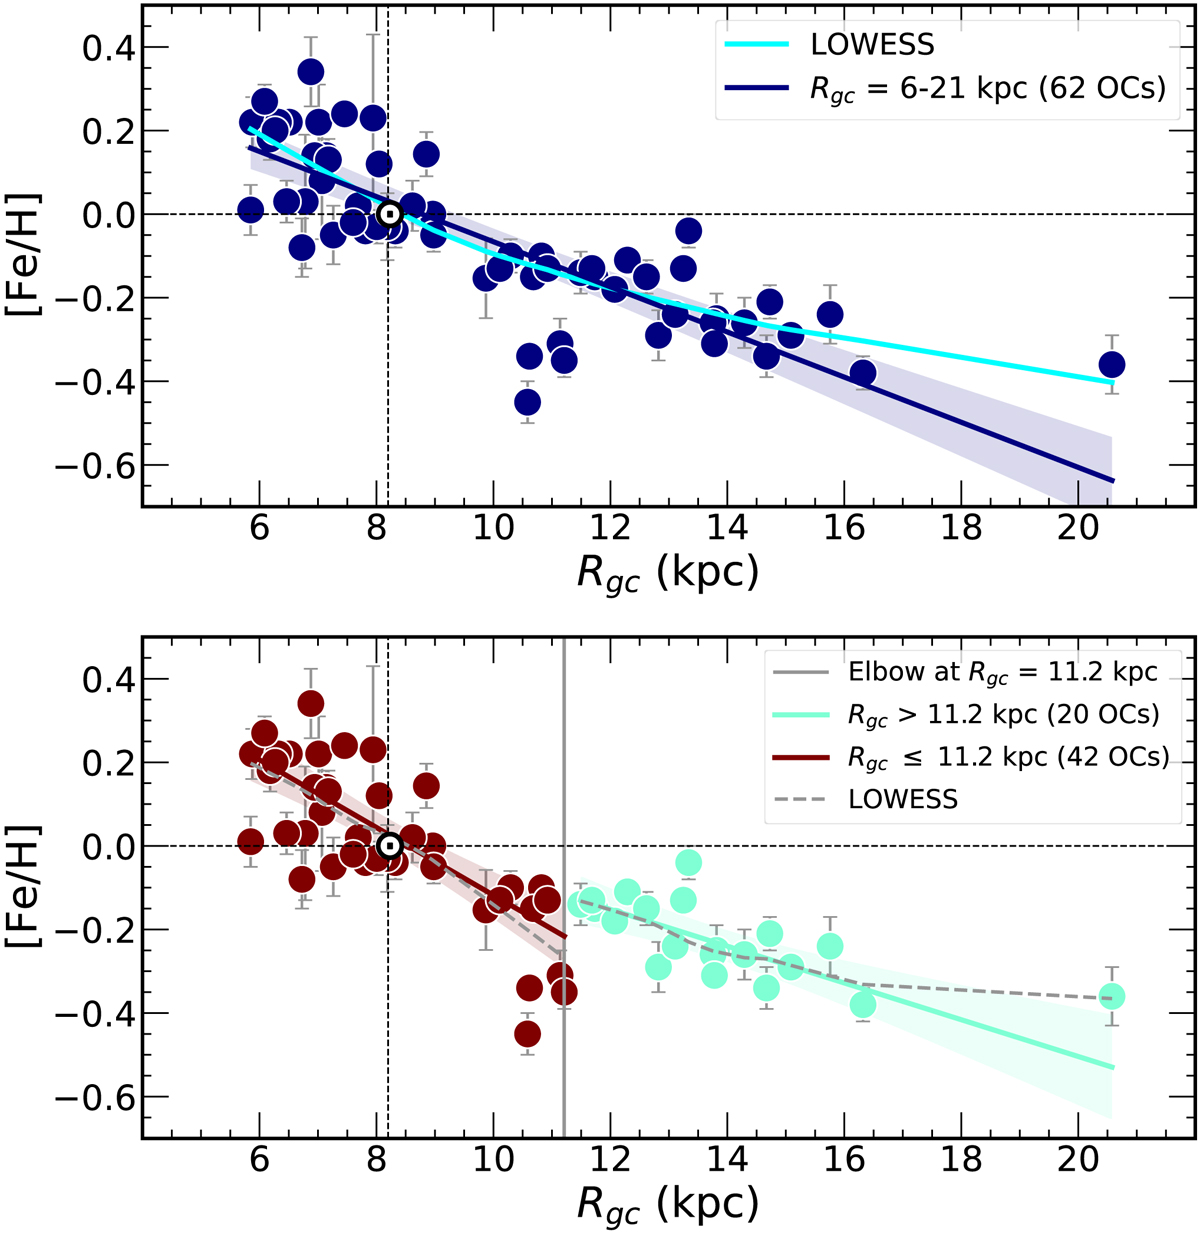
Fig. 1.
Download original image
Shape of radial [Fe/H] gradient. Upper panel: [Fe/H] vs RGC of our sample clusters. The blue line is a weighted linear regression model fit to the global trend and the shaded area shows the confidence interval. The cyan curve is the lowess fit. Bottom panel: [Fe/H] vs RGC with weighted linear regression model fits in two radial ranges, RGC ≤ 11.2 kpc (in brown) and RGC > 11.2 kpc (in turquoise). The shaded areas show the confidence intervals of the two fits and the dashed grey curves are the lowess models in the two intervals. The vertical grey line indicates the slope change point calculated by the elbow method. The dashed vertical and horizontal lines mark the location and abundance of the Sun.
Current usage metrics show cumulative count of Article Views (full-text article views including HTML views, PDF and ePub downloads, according to the available data) and Abstracts Views on Vision4Press platform.
Data correspond to usage on the plateform after 2015. The current usage metrics is available 48-96 hours after online publication and is updated daily on week days.
Initial download of the metrics may take a while.