| Issue |
A&A
Volume 669, January 2023
|
|
|---|---|---|
| Article Number | A41 | |
| Number of page(s) | 9 | |
| Section | Atomic, molecular, and nuclear data | |
| DOI | https://doi.org/10.1051/0004-6361/202244951 | |
| Published online | 03 January 2023 | |
Laboratory hydrogenation of the photo-fragments of PAH cations: Co-evolution interstellar chemistry
1
Deep Space Exploration Laboratory/CAS Key Laboratory of Crust-Mantle Materials and Environment, University of Science and Technology of China,
Hefei
230026, PR China
e-mail: This email address is being protected from spambots. You need JavaScript enabled to view it.
2
CAS Center for Excellence in Comparative Planetology, University of Science and Technology of China,
Hefei
230026, PR China
3
CAS Center for Excellence in Quantum Information and Quantum Physics, Hefei National Laboratory for Physical Sciences at the Microscale, and Department of Chemical Physics, University of Science and Technology of China,
Hefei
230026, PR China
4
CAS Key Laboratory for Research in Galaxies and Cosmology, Department of Astronomy, University of Science and Technology of China,
Hefei
230026, PR China
Received:
12
September
2022
Accepted:
16
November
2022
Abstract
To investigate co-evolution interstellar chemistry, we studied the gas-phase hydrogenation processes of possible photo-fragments of large polycyclic aromatic hydrocarbon (PAH) cations. Our experimental results show that hydrogenated photo-fragments of hexa-peri-hexabenzocoronene (HBC, C42H18) cations are efficiently formed. The predominance of even-mass fragments (C42H2n+, n = [0–9]) is observed in the photo-fragmentation experiments, while no even-odd hydrogenated mass patterns are observed in the hydrogenation experiments. We investigated the structure of these newly formed hydrogenated photo-fragments and the bonding energies for the reaction pathways with quantum chemistry calculations. We used a molecular kinetic reaction model to simulate the hydrogenation processes of the photo-fragments (e.g. C42H12+) as a function of the reaction time under the experimental conditions. We obtain the possible structure distribution of the newly formed hydrogenated fragments of C42H18+ and the infrared (IR) spectra of these possible molecules. We infer that the hydrogenation and photo-dehydrogenation channels are not reversible reaction channels. Hydrogenation tends to be more random and disorderly, with no restrictions or requirements for the carbon reaction sites of PAH species. As a result, under the co-evolution interstellar chemistry network, there is little chance that PAH compounds return to their initial state through hydrogenation processes after photo-dehydrogenation. Consequently, the hydrogenation states and forms of PAH compounds are intricate and complex in the interstellar medium (ISM).
Key words: asteroseismology / methods: laboratory: molecular / photon-dominated region (PDR) / ISM: molecules / molecular processes
Congcong Zhang and Xiaoyi Hu contribute equally to this work.
© The Authors 2023
 Open Access article, published by EDP Sciences, under the terms of the Creative Commons Attribution License (https://creativecommons.org/licenses/by/4.0), which permits unrestricted use, distribution, and reproduction in any medium, provided the original work is properly cited.
This article is published in open access under the Subscribe-to-Open model. This email address is being protected from spambots. You need JavaScript enabled to view it. to support open access publication.
1 Introduction
Polycyclic aromatic hydrocarbon (PAH) molecules and their derivatives are abundant and ubiquitous in many astronomical sources and are expected to account for ~ 10% of cosmic carbon (Sellgren 1984; Allamandola et al. 1989; Puget & Leger 1989). As a significant class of large organic interstellar molecules, PAHs play an important role in the energy and ionisation balance of the ISM (Tielens 2008; Berné et al. 2022b, and references therein) and catalyse the formation of molecular H2 in photodissociation regions (PDRs; Boschman et al. 2012). Interstellar chemical-evolution processes, including collision reactions (e.g. hydrogenation), photo-fragmentation, and ionisation, further modify the states and forms of these PAH compounds in interstellar environments, especially in PDRs (Tielens 2013, and references therein).
PDRs provide a natural laboratory for the study of the interaction of interstellar UV radiation, hydrogen atoms, hydrogen ions, and other molecules coexisting with carbonaceous species (Pety et al. 2005; Rapacioli et al. 2005; Hollenbach & Tielens 1999; Micelotta et al. 2010). Observations with the Spitzer Space Telescope and the Herschel Space Observatory of the prototypical PDR, NGC 7023, have revealed the important role of photochemistry in the destruction of interstellar PAHs (Malloci et al. 2008; Berné & Tielens 2012). The top-down processes behind PAH breakdown initiated by UV irradiation or energetic particle bombardment may be balanced with the bottom-up molecular growth processes (Tielens 2013; Zhen et al. 2018), where inside molecular clouds, atoms, radicals, or small coexisting molecules (e.g. smaller PAHs) can collide and cluster into larger molecular structures (Zhen et al. 2018).
Sophisticated models have been developed to calculate the IR emission spectra of PAH species and to aid in interpreting the observed spectral variations (Peeters et al. 2004). Variations in the charge state and composition of the interstellar PAH population in PDRs (Le Page et al. 2001; Montillaud et al. 2013; Andrews et al. 2015) have also been studied through modelling, and these changes are expected to affect the energetics and chemistry in these regions. Laboratory and quantum theoretical studies show that the creation of HnPAHs and the subsequent abstraction of excess hydrogen atoms through Eley–Rideal type reactions (forming H2 in the process) is a possible formation route under astrophysical conditions (Bauschlicher 1998; Thrower et al. 2012; Cazaux et al. 2016; Jensen et al. 2019). Jensen et al. (2019) measured the thermal desorption of the natural PAH molecule coronene (C24H12) in solid phase using mass spectrometry, and confirmed the presence of stable configurations of superhydrogenated coronene at specific hydrogenation levels, with 2, 10, 14, 18, and 24 extra hydrogen atoms. Meanwhile, on coronene cations, hydrogenation follows a well-defined sequence of hydrogenation sites, which has been confirmed by means of infrared spectroscopy in the gas phase (Cazaux et al. 2019). However, the reformation (e.g. hydrogenation) of large PAHs under relevant interstellar conditions (i.e. UV irradiation) has not yet received significant attention in terms of experimental simulations.
Interstellar PAHs and PAH-related species are expected to be substantially influenced by their chemical-physical conditions; for example strong radiation fields in space and H atom flux (Bakes & Tielens 1994; Le Page et al. 2001)). In this work, we track the hydrogenation processes taking place on photo-fragments of hexa-peri-hexabenzocoronene (HBC, C42H18) cations, and present a laboratory investigation of large, astronomically relevant cationic PAHs to demonstrate the co-evolution of interstellar chemistry with both hydrogenation and photo-fragmentation processes. The experimental results are illustrated with quantum chemical computations and molecular kinetic reaction simulations combined with astronomical data.
HBC (C42H18) is an all-benzenoid PAH that is used as a prototypical example for large(r) PAHs (Andrews et al. 2015; Croiset et al. 2016), as shown in Fig. 1, and its size lies within the astrophysically relevant range (Kokkin et al. 2008; Steglich et al. 2011; Gredel et al. 2011). Moreover, HBC has been selected for its unique molecular geometry; it has only CH groups with a ‘triply adjacent’ or ‘trio’ CH–CH–CH unit structure, which allows us to unambiguously identify the hydrogenation processes of the photo-fragments of large PAH cations (Zhen et al. 2017).
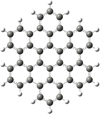 |
Fig. 1 Molecular geometry of hexa-peri-hexabenzocoronene (HBC, C42H18). |
2 Experimental results
Further details of our experiments are provided in Appendix A, but briefly, experiments were performed with an apparatus equipped with a quadrupole ion trap and reflection time-of-flight mass spectrometer. A H atom source was employed to produce the H atoms (Tschersich & Bonin 1998), with a flux of ~5.0 × 10¹⁴ H atoms cm−2 s−1. The third harmonic of a Nd:YAG laser (355 nm, ~6 ns, operated at 10 Hz with a laser energy of 2.0 mJ) was used to irradiate the trapped ions. The resulting evolution mass spectrum of the HBC cations is presented in Fig. 2.
Figure 2 (black line) shows the mass spectrum of the HBC cation before laser irradiation (the ion gate opens at 0.0–3.5 s). In addition to the main HBC mass peak (C42H18+, m/z = 522), peaks attributed to isotopic species that contain one to three 13C were observed at higher mass. In addition, some residual HBC fragments (peaks due to H loss) were also observed, such as C42H14/15/16/17+, m/z = 518, 519, 520, 521, generated as a byproduct of the electron impact ionisation and fragmentation processes (Zhen et al. 2014). Also shown (red line) is the resulting mass spectrum of trapped HBC cations upon 355 nm irradiation at a laser energy of 2.0 mJ (irradiation times amounting to 0.4 s, ranging from 3.5 to 3.9 s; i.e. typically four pulses). A wide range of dehydrogenated fragment ions is evident in these mass spectra and these are attributed to multiple, sequential photon absorption and subsequent photo-fragmentation events. The photo-dissociation of the C42H18 cation mainly follows sequential 2H (or H2) separations until full dehydrogenation, leading to the predominance of even-mass fragments C42H2n+ with n = [0-9]. This also shows the dehydrogenation photo-products as well as further fragmentation of the bare carbon cluster C42+ leading to C42–2m+ with m = [1–2], similar to previous observations (Zhen et al. 2014, 2017).
The violet line in Fig. 2 shows the evolution mass spectrum of the hydrogenated HBC cations with H atom exposure (H atom exposure is from 0.0 to 4.9 s, with a flux of ~5.0 × 10¹⁴ H atom cm−2 s−1) with no subsequent laser exposure during the hydrogenation experiments. A series of peaks of hydrogenated HBC cations is observed. Upon H atom exposure, the mass-to-charge ratio (m/z) distribution exhibits the expected shift to higher masses, accompanied by broadening. No even-odd mass peak patterns are observed in the mass spectrum during the hydrogenation experiments. In addition, the largest hydrogenated HBC cations is [C42H24]+, m/z = 528.
The green line in Fig. 2 shows the evolution mass spectrum of the hydrogenated HBC cations with H atom exposure (H atom exposure from 0.0 to 4.9 s, with a flux of ~5.0 × 10¹⁴ H atoms cm−2 s−1) with subsequent 355 nm irradiation at a laser energy of 2.0 mJ (irradiation times amounting to 0.4 s, ranging from 4.5 to 4.9 s; i.e. typically four pulses). A wide range of dehydrogenated fragment ions are evident in these mass spectra and are attributed to multiple, sequential photon absorption and subsequent photo-fragmentation events. The photodissociation of the hydrogenated HBC cation mainly includes sequential 2H (or H2) separations until full dehydrogenation occurs, leading to the predominance of even-mass fragments C42H2n+ with n = [0–9], as well as bare carbon clusters C42–2m+ with m = [1–2], which is similar to the photo-fragmentation behaviour of HBC cations, as indicated by the red line (Zhen et al. 2014).
The blue line in Fig. 2 shows the evolution mass spectrum of the hydrogenated photo-fragmentation of HBC cations upon 355 nm irradiation at a laser energy of 2.0 mJ followed by H atom exposure (laser irradiation from 3.5 to 3.9 s; i.e. typically four pulses, and H atom exposure from 3.9 to 4.9 s, with a flux of ~5.0 × 10¹⁴ H atoms cm−2 s−1 1). A series of peaks attributed to hydrogenated photo-fragment HBC cations is observed. Upon H atom exposure, compared with the mass spectrum without H atom exposure, the m/z distribution exhibits the expected shift to higher masses, accompanied by a broadening distribution. Importantly, the predominance of even-odd mass fragmentation patterns disappears; no even-odd patterns are observed during the hydrogenation experiments.
Moreover, we note that for the hydrogenation of pure carbon graphene cations, such as C40+, the distribution of hydrogenation follows a Gaussian distribution with a mean value of 3 or 4, with a reaction time of 1 s. We cannot calculate the mean hydrogenation value of HBC fragments, mainly because of the unknown H numbers on the PAH species and the presence of the isotopic species that contain one to three 13C atoms at the higher mass for each of them; here we therefore assume that the hydrogenation mean value of HBC fragments is the same as or similar to that of C40+.
Overall, hydrogenated photo-fragment cations are efficiently formed. The predominance of even-mass fragments is observed during the photo-fragmentation experiments, while no even-odd hydrogenated mass patterns are observed during the hydrogenation experiments, which suggests that the hydrogenation of PAH fragments is not exactly the opposite reaction to photodehydrogenation; we discuss the observed experimental results below, together with the calculation and simulation results.
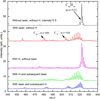 |
Fig. 2 Evolution mass spectrum of HBC cations. |
3 Quantum chemistry calculation results
We performed a quantum chemistry theoretical study of the hydrogenation processes of the photo-fragments of HBC cations in order to understand the obtained experiential results. As typical examples, here we take the ion-molecule collision reaction of C42H12+ + H to theoretically study the H accretion process on dehydrogenated PAHs (theoretical details are provided in Appendix B).
C42H12+ is one of the products formed during the photofragmentation of HBC cations. Based on the molecular structural symmetry of HBC+ (Castellanos et al. 2018), C42H12+ has many possible molecular structures. One typical molecular structure of C42H12+ is presented in Fig. 3. We assume that C42H18+ loses three H2 moieties, involving adjacent H atoms, to form the trio C–C–CH unit (duo-type), because once the first H atom in the PAH molecule is lost, an adjacent H is also lost, allowing the formation of a triple bond (Castellanos et al. 2018). In addition, we chose to put all three trio C–C–CH units on one side of the cation. C42H12+ has an odd number of electrons, resulting in an open-shell doublet ground electronic state (the spin multiplicity is 2). Based on previous theoretical calculation results, we simply assume that H atom attachment and abstraction tend to occur on the outer carbon sites (Elias et al. 2009; Cazaux et al. 2016).
We chose two typical carbon units as examples to calculate the reaction pathways of C42H12+ with H atoms: the first typical carbon unit is the trio CH–CH–CH unit (Fig. 3A), and the second typical carbon unit is the trio C–C–CH unit (Fig. 3B).
Figure 3A presents the reaction pathways by which C42H12+ forms the trio CH–CH–CH unit with H atoms. Three possible reaction pathways and the optimised structures of [C42H12+ H]+ are obtained based on the outer-edge carbon sites of C42H12+ (1, 2 and 3), and all three reaction pathways include the formation of aliphatic C-H bonds: [C42H12 + 1H(1)]+, [C42H12 + 1H(2)]+, and [C42H12 + 1H(3)]+. Clearly, all the reaction pathways are exothermic, with energies of 2.1 eV for [C42H12 + 1H(1)]+, 1.6 eV for [C42H12 + 1H(2)]+, and 2.2eV for [C42H12 + 1H(3)]+. C42H12+ (2) has a reactivity similar to that of C42H12+ (1 and 3), and the formation pathways of [C42H12+1H(1)]+, [C42H12+1H(2)]+, and [C42H12+1H(3)]+ are all energetically favourable.
For the reaction of [C42H12+1H(1)]+ + H, three possible reaction pathways are obtained: [C42H12 + 2H(1,2)]+, [C42H12 + 2H(1,3)+, and [C42H12]++H2. There are also three possible reaction pathways obtained for the reactions of [C42H12+1H(2)]+ + H, namely [C42H12 + 2H(1,2)]+, [C42H12 + 2H(2,3)+, and [C42H12]+ +H2, and of [C42H12+1H(3)]+ +H, namely [C42H12+2H(1,3)]+, [C42H12+2H(2,3)+, and [C42H12]++ H2. Clearly, all the reaction pathways are exothermic, with energies in the range of 1.0–2.6 eV, which suggests that all the formation pathways are energetically favourable. These 9 reaction pathways can be categorised into two types: for [C42H12 + 2H(1,2)]+, [C42H12 + 2H(2,3)]+, and [C42H12+ 2H(1,3)]+, two CH2 units are formed, that is, hydrogenated cations are formed; for [C42H12]+, H2 is formed. The ratio between these two types of reaction pathways is 3:1.
Similarly, Fig. 3B presents the reaction pathways by which C42H12+ forms the trio C–C–CH unit with H atoms. For the C–C–CH unit, we label the carbon sites as 4, 5, and 6. Three possible reaction pathways and the optimised structures of [C42H12+H]+ are obtained based on the outer-edge carbon sites of C42H12+ (4, 5, and+ 6): [C42H12+1H(4)]+, [C42H12+1H(5)]+, and [C42H12+1H(6)]+. Clearly, all the reaction pathways are exothermic, with energies of 2.9eV for [C42H12+1H(4)]+, 1.8 eV for [C42H12+1H(5)]+, and 2.3 eV for [C42H12+1H(6)]+. All the formation pathways are energetically favourable.
For the reaction of [C42H12+1H(4)]+ + H, three possible reaction pathways are obtained: [C42H12 + 2H(4,5)]+, [C42H12 + 2H(4,4)+, and [C42H12 +2H(4,6)+. Similarly, three possible reaction pathways are obtained for the reactions of [C42H12+1H(5)]+ + H, namely [C42H12 +2H(4,5)]+, [C42H12+ 2H(5,5)+, and [C42H12 +2H(5,6)+, and for [C42H12+1H(6)]+ + H, namely [C42H12 + 2H(4,6)]+, [C42H12 +2H(5,6)+, and [C42H12]+ + H2. Clearly, all the reaction pathways are exothermic, with energies in the range of 2.0–5.0 eV, which suggests that all the formation pathways are energetically favourable. These nine different reaction pathways can be categorised into two types: first, the formation of new hydrocarbon bonds, such as the formation of two C–H bonds in the [C42H12 + 2H(4,5)]+ groups and the formation of one CH unit and one CH2 unit formed in the groups of [C42H12 +2H(4,6)]+ and [C42H12 +2H(5,6)]+; and second, hydrogen generation in the [C42H12]+ groups. The ratio between these two types of reaction pathways is 8:1.
Overall, the exothermic energy for each reaction pathway is relatively high, which is consistent with the experimental results. The exothermic energies of the hydrogenation and dehydrogenation reaction pathways on the different types of units (e.g. trio CH–CH–CH unit, or trio C–C–CH unit) of [C42H12]+ are similar. We also conclude that adding H atoms to the carbon skeleton of [C42H12]+ is a relatively independent event. As these reaction pathways are relatively independent and random events, the chance of their occurrence is entirely determined by the already hydrogenated carbon sites and the remaining unhydrogenated carbon sites on the carbon skeleton of large cationic PAHs (Cazaux et al. 2016). We note that we did not perform all these related theoretical calculations. When the amount of hydrogen addition is high, some intramolecular interactions and other reaction formation pathways may also exist.
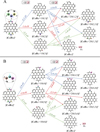 |
Fig. 3 Theoretical calculation results for the hydrogenation processes of C42H12+. Panel A presents the reaction pathways of ‘trio’ CH–CH–CH unit with H atoms and panel B presents the reaction pathways of ‘trio’ C–C–CH unit with H atoms. |
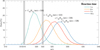 |
Fig. 4 Molecular kinetic reaction model simulation results. The calculated distribution abundances of [C42Hn]+ as a function of the reaction time (1, 4, 7, and 10 s) are shown for the reaction between C42H12+ and H atoms under our experimental conditions. |
4 Molecular kinetic reaction simulation results
A molecular kinetic reaction simulation model was constructed to simulate the ion-molecule collisions between [C42H12]+ and H atoms, and we obtained the formed products and the hydrogenation and dehydrogenation processes as a function of reaction time (simulation details are provided in Appendix C). Based on our theoretical calculation, the exothermic energy for each reaction pathway (reactions on peripheral carbon sites) is relatively high, meaning that the ion–molecule reactions between the PAH and H atoms are mainly one-off collision reactions. Therefore, the effective reaction cross section in our model only accounts for the area of reactive (peripheral) carbon sites, and neglects the H atoms that initially land in the inner parts of the PAH. For the reaction between C42H12+ and H atoms under our experimental conditions (the volume density of H-atoms is ~5 × 109 cm−3, and the environment temperature is T = 300 K), the simulated results are presented in Figs. 4 and 5.
Figure 4 presents the intensity ratio of [C42Hn]+ with increasing reaction time (1, 4, 7, and 10 s); the total intensity is normalised to 1. For example, with a 1 s reaction time, the mass of [C42Hn]+ is in the range of 516–524, and the highest ratio of these masses is m/z = 519 (~21%). As the reaction time increases, the mass of [C42Hn]+ increases, and the distribution becomes broader. The simulation results, such as those for the mass distribution, agree with the observed experimental results in Fig. 2. For example, as presented in Fig. 4 (green line), the distribution of hydrogenation of C42H12+ follows a Gaussian distribution with a mean value of 3, when the reaction time is 1 s, which is similar to the hydrogenation behavior of C40+, as presented in Fig. 2 (blue line).
We also label the newly formed mass m/z = 522 in Fig. 4, because it has the same mass as the HBC molecule and we focus on this specific case and its various isomers. Based on the above calculation results, the newly formed C42H18+ (m/z = 522) has a very wide range of possible molecular structures, which may contain different numbers of CH, C, and CH2 units on the periphery of C42H18+ for each configuration. These units may also be located on different carbon sites. In addition, as the total number of peripheral carbons of C42H18+ is 18 (i.e. n1(CH) + n2(C) + n3(CH2)= 18) and the total number of hydrogen atoms on the C42H18+ is 18 (i.e. n1(CH) + 2 × n3(CH2) = 18), it is clear that n2(C) = n3(CH2).
Figure 5 presents the distribution of these units and the ratio of these units to the number of newly formed m/z = 522 [C42H18]+ produced from C42H12+ + H atoms as a function of reaction time (1, 4, 7, and 10 s). We come to several interesting conclusions from the results shown in Fig. 5: first, the molecules obtained after the hydrogenation process have almost no possibility of returning to the original molecular structure, namely the HBC molecule ((n1, n2, n3) = (18, 0, 0)), although they have the same mass; second, the molecular structure of the obtained molecules has a very wide distribution, with several main structures, and their main distribution is (n1, n2, n3) = (8, 5, 5), (10, 4, 4), and (12, 3, 3); and third, the distribution of the molecular structure of these molecules changes with the reaction time, and the ratio of the CH group increases during the reaction. As a result, there is little chance that PAH compounds return to their initial state through hydrogenation processes after photo-dehydrogenation. Consequently, the structures of large PAHs formed through this process are diverse. Furthermore, our results also illustrate the important role of reaction time and the connection of units to the carbon skeleton.
Meanwhile, we validated the vibration modes and corresponding infrared intensities of several differently structured molecules with the same m/z (522), [C42H18]+, as presented in Appendix D. For molecules with same distribution of units, these units may be located on different carbon sites to form different molecular structures, as (n1, n2, n3) = (10, 4, 4)1–4 representatively constructed (Fig. D.1, panel A1–4). For molecules with different unit distributions, two typical examples of (n1, n2, n3) = (8, 5, 5) and (12, 3, 3) are constructed (Fig. D.1, panels B and C). We also present the IR spectra of HBC ((n1, n2, n3) = (18, 0, 0)) and relevant details of potential interest to the reader (Fig. D.1, panel D).
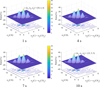 |
Fig. 5 Molecular kinetic reaction model simulation results. Here we show the ratio intensity of all these units (C, CH, and CH2) in C42H18+ (m/z = 522) species. |
5 Astronomical implications and conclusions
Large interstellar molecules, represented by PAH compounds, as a complex molecular system, have very complex characteristics in terms of spatial distribution, and molecular and spatial evolution in interstellar space. In the interstellar environment, PAH molecules are affected and constrained by different environmental factors over time, such as interstellar UV radiation, and the flux of H atoms, hydrogen ions, and other coexisting molecules. These environmental factors provide feedback and constraints on PAH molecules during different interstellar evolution periods. In the present paper, based on the co-evolution network, we demonstrate the processes taking place in PAH molecules in response to extreme UV radiation and H atom bombardment from different perspectives, including in physical experiments, quantitative calculations, and molecular dynamics modelling.
The evolution of PAH molecules in response to UV radiation and H atom bombardment is very complex. Figures 3-5 show that the possible molecular structures, and the corresponding molecular spectra are diverse even with the same molecule mass. This requires us to be very careful when considering the spectra of interstellar observations and to take an approach closer to the current results from our obtained theoretical and experimental simulations. Photo-fragmentation is one of the main destruction pathways for PAHs in space (Tielens 2008). From the obtained results, we infer that the formation and dissociation of C–H bonds play an important role in the chemical evolution process of PAHs in the ISM.
The dissociation energies of different types of C–H bonds (e.g. aromatic, or aliphatic) at the periphery of the PAHs may provide clues as to the aliphatic-to-aromatic ratio in some specific PAH host environments. Our theoretical calculations indicate that losing hydrogen atoms bonded to aliphatic carbons (those that carry only σ or single bonds) is easier than losing hydrogen atoms bonded to aromatic carbons (those that share in the delocalised π bonding of the molecule). This is a common characteristic of mixed aromatic–aliphatic species (Castellanos et al. 2018; West et al. 2018). As such, when undergoing co-evolution driven by UV irradiation or some other energetic source, losing H bonded to aliphatic carbons is energetically preferable, that is, CH2 to CH + H, and the odd–even alternance of the H number during this process may be different from the pure hydrogenation process of interstellar PAHs. In addition, during photo-dehydrogenation, the sporadic absorption of UV photons may constantly reshuffle the distribution of H atoms on PAHs.
The results we obtain once again validate the complexity of the molecular structure of PAH molecules in interstellar space with the superposition of the interactions of different environmental factors. The data also support and provide direction for our future treatment of interstellar evolution simulations, especially synergetic evolution simulations. Finally, we present results on the hydrogenation processes of the photo-fragments of large PAH cations studied in the gas phase. With photodissociation by laser and formation by gas-phase condensation (collision reaction), PAH clusters evolve to become structurally more complicated.
Significantly, the gas inside PDRs is mainly heated by the photoelectric effect on PAH molecules and small dust grains (Verstraete et al. 1990; Bakes & Tielens 1994; Weingartner & Draine 2001). The aromatic infrared bands (AIBs), which are key PDR signatures in the near- and mid-IR regions, are mainly attributed to PAHs and related species that are heated by the absorption of UV photons (Leger & Puget 1984; Allamandola et al. 1985). Therefore, most of the galactic and extragalactic observations obtained with the newly launched infrared James Webb Space Telescope (JWST) will encompass PDR emissions and will help astrochemical researchers to elucidate the distribution and molecular and spatial evolution characteristics of PAH molecules in interstellar environments (Berné et al. 2022a).
Acknowledgements
This work is supported by the Strategic Priority Research Program of Chinese Academy of Sciences, Grant No. XDB 41000000, the National Natural Science Foundation of China (NSFC, Grant Nos. 41930216, 12073027, and 21827804), the Pre-research Project on Civil Aerospace Technologies (D020202) of the Chinese National Space Administration, and the Fundamental Research Funds for the Central Universities of China (WK3410000019). The theoretical calculations were performed at the Supercomputing Center of China’s University of Science and Technology.
Appendix A Experimental methods
Here we provide a brief description of the experimental methods used in this study. Neutral HBC (C42H18) was converted into the gas phase by heating HBC in powdered form (provided by Kentax, with a purity greater than 99.5%) in an oven (~580 K). Subsequently, evaporated HBC molecules were ionized and transported into the ion trap via an ion gate. During this procedure, helium gas was introduced continuously into the trap via a leaking valve to thermalise the ion cloud through collisions (~300 K). The third harmonic of an Nd:YAG laser (INDI, Spectra-Physics) at 355 nm, and the pulse duration of ~6 ns, operated at 10 Hz was used to irradiate the trapped ions. A beam shutter (Uniblitz, XRS-4) served as a physical shield inside the chamber and determines the interaction time of the light with the trapped ions. The shutter was externally triggered to guarantee that the ion cloud was irradiated for a specified time during each cycle. A high-precision delay generator (SRS DG535) was used to control the full timing sequence. Our setup was operated with a typical frequency of 0.2 Hz; one full measuring cycle lasted 5.0s.
A hydrogen atom beam source (HABS; MBE-Komponenten GmbH; Tschersich & Bonin (1998)) was installed to produce the H atoms. The H atoms were formed by cracking H2 gas (with a purity greater than 99.99%) using a tungsten capillary at ~2173 K. The chamber pressure during the H atom beam exposition was ~1.2 * 10−6 mbar with H2 flowing through the HABS (the typical background pressure in the chamber was ~6.0 * 10−7 with helium gas). The working distance from the end of the tungsten capillary to the centre of the ion trap was ~5.0 cm. The H atom flux was incident into the ion trap, through a 2.4 mm aperture in the ion trap ring electrode. Based on the operating conditions, the H-atoms were expected to have a flux of ~5.0 * 1014 H-atoms cm−2 s−1.
Appendix B Quantum chemistry calculation methods
Theoretical calculations were carried out within the framework of density functional theory (DFT) with the hybrid density functional B3LYP (Becke 1992; Lee et al. 1988) as implemented in the Gaussian 16 program (Frisch et al. 2016). The 6-311++G(d,p) basis set was used for all calculations. In the calculations, the geometries of all species were optimised at the local minimum of their potential energy surface. The zero-point energy and thermal corrections were obtained from frequency calculations to correct the molecular energy.
For these newly formed PAH molecules, theoretical IR spectra were calculated, and the calculations were performed with the 6-311++G(d,p) basis set. The vibrational band positions were scaled by a constant factor of 0.9670, and the black line represents the spectra simulated by Gaussians with a full width at half maximum of 4 cm−1 (Boersma et al. 2014).
Appendix C Molecular kinetic simulation methods
A kinetic model was constructed to simulate the ion-molecular collisions between the photo-fragments of HBC cations and H atoms in the gas phase. In this work, we chose C42H12+ as an example of the photo-fragments of HBC cations. The simulation program was run based on the Monte Carlo method.
The assumptions for the simulation:
- (1)
Due to the unique two-dimensional molecular geometry of HBC, the effective reaction cross section was obtained by projecting the geometric area of the reactive carbon sites in the incident direction of H atoms.
- (2)
The rate distribution of the incident H atoms was assumed to follow a Maxwell distribution. As the mass of these cationic PAHs is relatively large, we neglected the motion of these cationic PAHs and treated them as stationary.
- (3)
The incidence of H atoms was considered to follow a Poisson process.
- (4)
The reaction with H atoms on the outer edge of the carbon skeleton of C42H12+ was assumed to be a relatively independent event. As the hydrogenation processes were relatively independent and random, the chance of occurrence was determined by the already hydrogenated carbon sites and the remaining unhydrogenated carbon sites.
The procedures for the simulation:
- (1)
Set the start and end times, the initial state of the molecule, and environmental parameters such as the temperature and atomic number density.
- (2)
Sample a collisional interval at one-time point, and then obtain the next incidence time.
- (3)
Sample the incidence of cationic PAHs, and then determine the specific processes that occur on the cationic PAHs.
- (4)
Record the numbers of CH, C, and CH2 units on the PAHs.
- (5)
If the termination time is reached, end this round; if not, continue from step 2.
- (6)
All of the simulation results are based on the statistical averaging of 1 million cationic PAHs.
Appendix D Vibration modes and corresponding infrared intensity of the isomers of HBC+
The IR spectra of these isomers of HBC+ are presented in Figure D.1, in the range of 0–4000 cm−1. As presented in Figure D.1, the IR spectra of HBC cations generally differ from those of the newly formed [C42H18]+ molecules. The IR spectrum (fingerprint range, 2000–400 cm−1) is very complex, and we cannot identify the characteristic peaks. However, some old vibrational modes are preserved, while others are not; at the same time, some new vibrational modes have emerged.
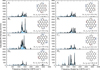 |
Fig. D.1 Quantum computed vibrational normal modes of isomers of HBC+ ((n1, n2, n3) = (18, 0, 0)) in the range of 0–4000 cm−1. Panel (A1–4) shows the IR spectrum of [C42H18]+, (n1, n2, n3) = (10, 4, 4)1–4; panel (B) shows the IR spectrum of [C42H18]+, (n1, n2, n3) = (8, 5, 5); panel (C) shows the IR spectrum of [C42H18]+, (n1, n2, n3) = (12, 3, 3); and panel (D) shows the IR spectrum of HBC cations, (n1, n2, n3) = (18, 0, 0). The vibrational band positions are scaled by a constant factor of 0.9670, and the black line represents the spectra simulated by Gaussians with a full width at half maximum of 4 cm−1 (Boersma et al. 2014). |
References
- Allamandola, L. J., Tielens, A. G. G. M., & Barker, J. R. 1985, ApJ, 290, L25 [Google Scholar]
- Allamandola, L. J., Tielens, A. G. G. M., & Barker, J. R. 1989, ApJS, 71, 733 [Google Scholar]
- Andrews, H., Boersma, C., Werner, M. W., et al. 2015, ApJ, 807, 99 [NASA ADS] [CrossRef] [Google Scholar]
- Bakes, E. L. O., & Tielens, A. G. G. M. 1994, ApJ, 427, 822 [NASA ADS] [CrossRef] [Google Scholar]
- Bauschlicher, C. W. J. 1998, ApJ, 509, L125 [NASA ADS] [CrossRef] [Google Scholar]
- Becke, A. D. 1992, JChPh, 96, 2155 [NASA ADS] [Google Scholar]
- Berné, O., & Tielens, A. G. G. M. 2012, PNAS, 109, 401 [CrossRef] [Google Scholar]
- Berné, O., Habart, É., Peeters, E., et al. 2022a, PASP, 134, 054301 [CrossRef] [Google Scholar]
- Berné, O., Foschino, S., Jalabert, F., et al. 2022b, A&A, 667, A159 [NASA ADS] [CrossRef] [EDP Sciences] [Google Scholar]
- Boersma, C., Bauschlicher, C. W. Jr., Ricca, A., et al. 2014, ApJS, 211, 8 [NASA ADS] [CrossRef] [Google Scholar]
- Boschman, L., Reitsma, G., Cazaux, S., et al. 2012, ApJ, 761, L33 [NASA ADS] [CrossRef] [Google Scholar]
- Candian, A., Zhen, J., & Tielens, A. G. G. M. 2018, Phys. Today, 71, 38 [NASA ADS] [CrossRef] [Google Scholar]
- Castellanos, P., Candian, A., Zhen, J., Linnartz, H., & Tielens, A. G. G. M. 2018, A&A, 616, A166 [NASA ADS] [CrossRef] [EDP Sciences] [Google Scholar]
- Cazaux, S., Boschman, L., Rougeau, N., et al. 2016, Sci. Rep., 6, 19835 [NASA ADS] [CrossRef] [Google Scholar]
- Cazaux, S., Arribard, Y., Egorov, D., et al. 2019, ApJ, 875, 27 [NASA ADS] [CrossRef] [Google Scholar]
- Croiset, B. A., Candian, A., Berné, O., & Tielens, A. G. G. M. 2016, A&A, 590, A26 [NASA ADS] [CrossRef] [EDP Sciences] [Google Scholar]
- Elias, D. C., Nair, R. R., Mohiuddin, T. M. G., et al. 2009, Science, 323, 610 [NASA ADS] [CrossRef] [Google Scholar]
- Frisch, M. J., Trucks, G. W., Schlegel, H. B., et al. 2016, Gaussian 16, Revision e. 01 (Wallingford, CT: Gaussian, Inc.) [Google Scholar]
- Gredel, R., Carpentier, Y., Rouillè, G., et al. 2011, A&A, 530, A26 [CrossRef] [EDP Sciences] [Google Scholar]
- Hollenbach, D. J., & Tielens, A.G.G.M. 1999, RMP, 71, 173 [CrossRef] [Google Scholar]
- Jensen, P. A., Leccese, M., Simonsen, F. D., et al. 2019, MNRAS, 486, 5492 [NASA ADS] [CrossRef] [Google Scholar]
- Kokkin, D. L., Troy, T. P., Nakajima, M., et al. 2008, ApJ, 681, 49 [Google Scholar]
- Lee, C., Yang, W., & Parr, R. G. 1988, PhReB, 37, 785 [NASA ADS] [Google Scholar]
- Leger, A., & Puget, J. L. 1984, A&A, 137, L5 [Google Scholar]
- Le Page, V., Snow, T. P., & Bierbaum, V. M. 2001, ApJS, 132, 233 [NASA ADS] [CrossRef] [Google Scholar]
- Malloci, G., Mulas, G., Cecchi-Pestellini, C., & Joblin, C. 2008, A&A, 489, 1183 [NASA ADS] [CrossRef] [EDP Sciences] [Google Scholar]
- Micelotta, E. R., Jones, A. P., & Tielens, A. G. G. M. 2010, A&A, 510, A37 [NASA ADS] [CrossRef] [EDP Sciences] [Google Scholar]
- Montillaud, J., Joblin, C., & Toublanc, D. 2013, A&A, 552, A15 [NASA ADS] [CrossRef] [EDP Sciences] [Google Scholar]
- Peeters, E., Allamandola, L. J., Bauschlicher, C. W. Jr., et al. 2004, ApJ, 604, 252 [NASA ADS] [CrossRef] [Google Scholar]
- Pety, J., Teyssier, D., Fossé, D., et al. 2005, A&A, 435, 885 [NASA ADS] [CrossRef] [EDP Sciences] [Google Scholar]
- Puget, J. L., & Leger, A. 1989, ARA&A, 27, 161 [NASA ADS] [CrossRef] [Google Scholar]
- Rapacioli, M., Joblin, C., & Boissel, P. 2005, A&A, 429, 193 [NASA ADS] [CrossRef] [EDP Sciences] [Google Scholar]
- Sellgren, K. 1984, ApJ, 277, 623 [Google Scholar]
- Steglich, M., Bouwman, J., Huisken, F., & Henning, T. 2011, ApJ, 742, 2 [NASA ADS] [CrossRef] [Google Scholar]
- Thrower, J., Jørgensen, B., Friis, E., et al. 2012, ApJ, 752, 3 [NASA ADS] [CrossRef] [Google Scholar]
- Tielens, A. G. G. M. 2008, ARA&A, 46, 289 [NASA ADS] [CrossRef] [Google Scholar]
- Tielens, A. G. G. M. 2013, RvMP, 85, 1021 [NASA ADS] [Google Scholar]
- Tschersich, K. G., & von Bonin, V. 1998, J. Appl. Phys., 84, 4065 [NASA ADS] [CrossRef] [Google Scholar]
- Verstraete, L., Leger, A., D’Hendecourt, L., Defourneau, D., & Dutuit, O. 1990, A&A, 237, 436 [Google Scholar]
- Weingartner, J. C., & Draine, B. T. 2001, Astrophys. J. Suppl. Ser., 134, 263 [NASA ADS] [CrossRef] [Google Scholar]
- West, B., Castillo, S. R., Sit, A., et al. 2018, PCCP, 20, 7195 [NASA ADS] [CrossRef] [Google Scholar]
- Zhen, J., Castellanos, Bouwman, J., D. M., Linnartz, H., & Tielens, A. G. G. M. 2017, ApJ, 836, 28 [NASA ADS] [CrossRef] [Google Scholar]
- Zhen, J., Paardekooper, D. M., Candian, A., Linnartz, H., & Tielens, A. G. G. M. 2014, CPL, 592, 211 [NASA ADS] [CrossRef] [Google Scholar]
- Zhen, J., Chen, T., & Tielens, A. G. G. M. 2018, ApJ, 863, 128 [NASA ADS] [CrossRef] [Google Scholar]
- Zhen, J., Zhang, W., Yang, Y., Zhu, Q., & Tielens, A. G. G. M. 2019, ApJ, 887, 70 [NASA ADS] [CrossRef] [Google Scholar]
We note that we do not have a vacuum shutter inside the chamber and determine the interaction time of the H atoms with the trapped ions. Therefore, the hydrogen addition process also occurs during the period from 0.0 to 3.9 s; we assume that the resulting photo-fragmentation result is similar to results shown by the red line in Fig. 2, and the hydrogenation effect can be ignored.
All Figures
|
Fig. 1 Molecular geometry of hexa-peri-hexabenzocoronene (HBC, C42H18). |
| In the text | |
|
Fig. 2 Evolution mass spectrum of HBC cations. |
| In the text | |
|
Fig. 3 Theoretical calculation results for the hydrogenation processes of C42H12+. Panel A presents the reaction pathways of ‘trio’ CH–CH–CH unit with H atoms and panel B presents the reaction pathways of ‘trio’ C–C–CH unit with H atoms. |
| In the text | |
|
Fig. 4 Molecular kinetic reaction model simulation results. The calculated distribution abundances of [C42Hn]+ as a function of the reaction time (1, 4, 7, and 10 s) are shown for the reaction between C42H12+ and H atoms under our experimental conditions. |
| In the text | |
|
Fig. 5 Molecular kinetic reaction model simulation results. Here we show the ratio intensity of all these units (C, CH, and CH2) in C42H18+ (m/z = 522) species. |
| In the text | |
|
Fig. D.1 Quantum computed vibrational normal modes of isomers of HBC+ ((n1, n2, n3) = (18, 0, 0)) in the range of 0–4000 cm−1. Panel (A1–4) shows the IR spectrum of [C42H18]+, (n1, n2, n3) = (10, 4, 4)1–4; panel (B) shows the IR spectrum of [C42H18]+, (n1, n2, n3) = (8, 5, 5); panel (C) shows the IR spectrum of [C42H18]+, (n1, n2, n3) = (12, 3, 3); and panel (D) shows the IR spectrum of HBC cations, (n1, n2, n3) = (18, 0, 0). The vibrational band positions are scaled by a constant factor of 0.9670, and the black line represents the spectra simulated by Gaussians with a full width at half maximum of 4 cm−1 (Boersma et al. 2014). |
| In the text | |
Current usage metrics show cumulative count of Article Views (full-text article views including HTML views, PDF and ePub downloads, according to the available data) and Abstracts Views on Vision4Press platform.
Data correspond to usage on the plateform after 2015. The current usage metrics is available 48-96 hours after online publication and is updated daily on week days.
Initial download of the metrics may take a while.