Fig. D.1
Download original image
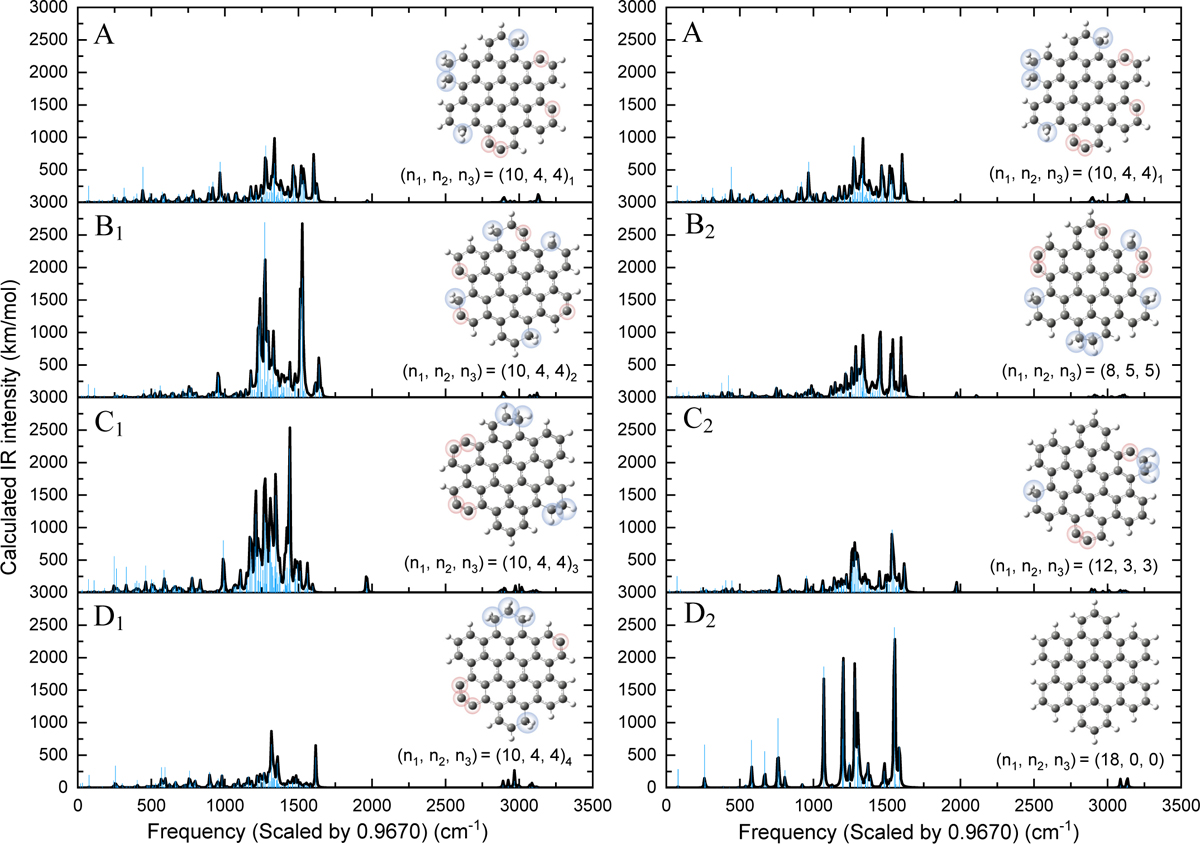
Quantum computed vibrational normal modes of isomers of HBC+ ((n1, n2, n3) = (18, 0, 0)) in the range of 0–4000 cm−1. Panel (A1–4) shows the IR spectrum of [C42H18]+, (n1, n2, n3) = (10, 4, 4)1–4; panel (B) shows the IR spectrum of [C42H18]+, (n1, n2, n3) = (8, 5, 5); panel (C) shows the IR spectrum of [C42H18]+, (n1, n2, n3) = (12, 3, 3); and panel (D) shows the IR spectrum of HBC cations, (n1, n2, n3) = (18, 0, 0). The vibrational band positions are scaled by a constant factor of 0.9670, and the black line represents the spectra simulated by Gaussians with a full width at half maximum of 4 cm−1 (Boersma et al. 2014).
Current usage metrics show cumulative count of Article Views (full-text article views including HTML views, PDF and ePub downloads, according to the available data) and Abstracts Views on Vision4Press platform.
Data correspond to usage on the plateform after 2015. The current usage metrics is available 48-96 hours after online publication and is updated daily on week days.
Initial download of the metrics may take a while.