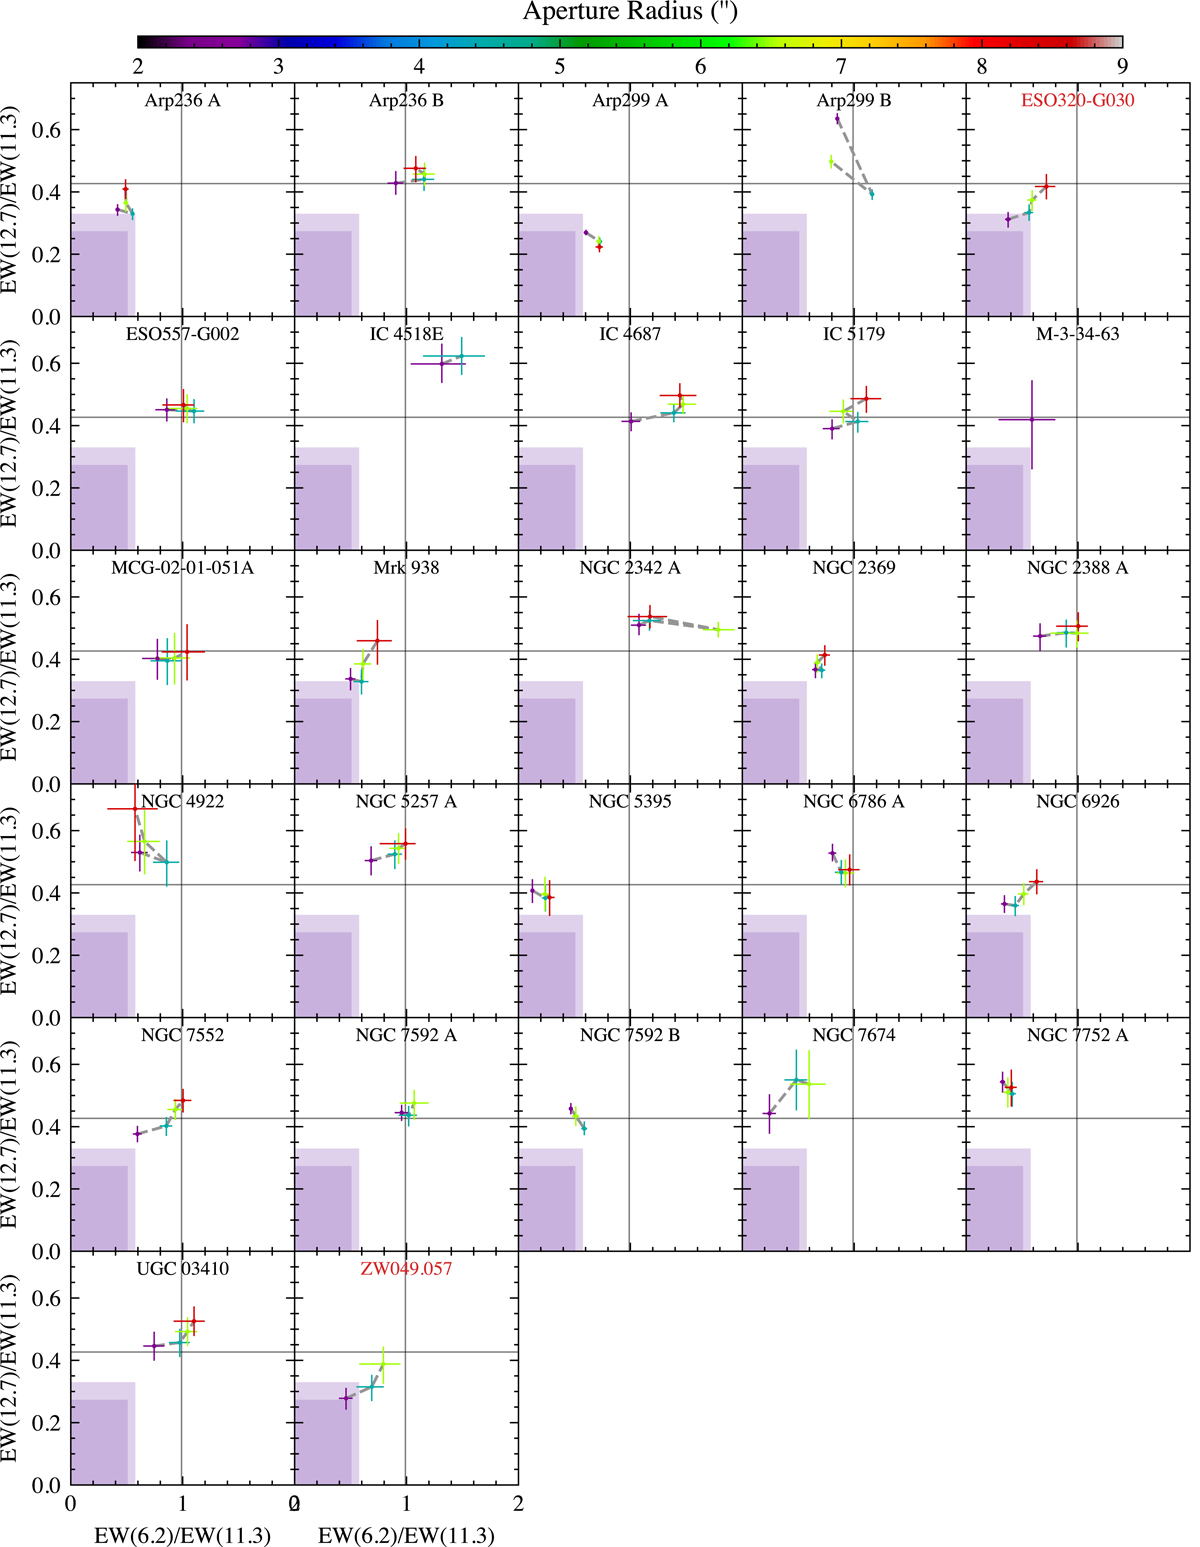
Fig. 9.
Download original image
EW ratios of the 12.7/11.3 PAH and the 6.2/11.3 PAH for the spectral mapping sample. For each galaxy, values are coloured by the aperture radius used to extract the spectra; a larger aperture will contain more emission from star formation in the galactic disc. The inner purple box shows the CON selection region as defined for the staring mode spectra, and the outer box shows a larger selection region that accounts for aperture correction effects. The grey lines show the mean EW ratios for the star-forming calibration sample. The two bona fide CONs are shown with a red title.
Current usage metrics show cumulative count of Article Views (full-text article views including HTML views, PDF and ePub downloads, according to the available data) and Abstracts Views on Vision4Press platform.
Data correspond to usage on the plateform after 2015. The current usage metrics is available 48-96 hours after online publication and is updated daily on week days.
Initial download of the metrics may take a while.