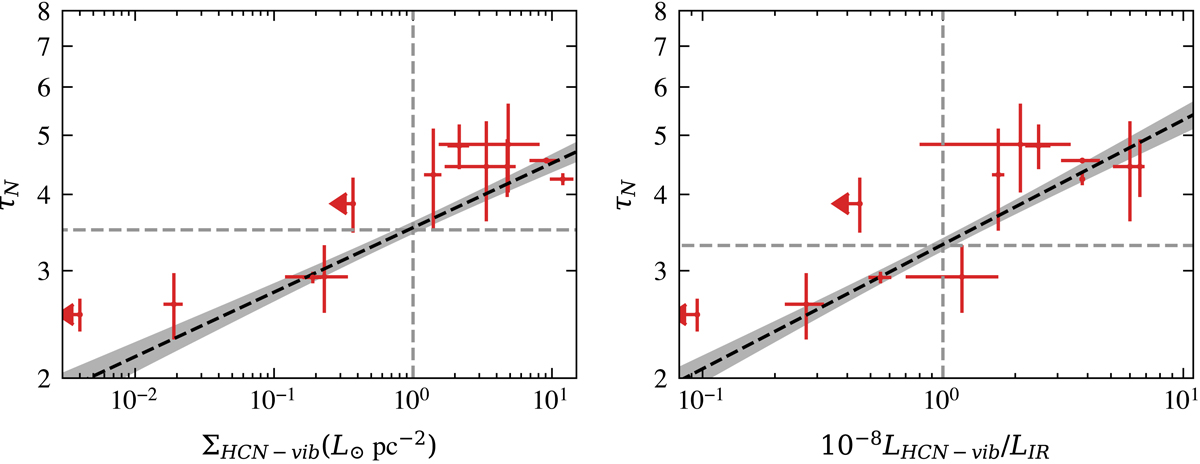
Fig. 7.
Download original image
Optical depth of the nuclear component from the spectral decomposition fits to the CONquest sample (Falstad et al. 2021) against the surface brightness of HCN-vib (left) and the strength of HCN-vib to LIR (right). Linear fits are shown in the dashed black lines, with 1σ confidence intervals shown in grey. The upper limits of HCN-vib measurements are shown for objects with τN > 2.5 and β > 0.4. The dashed grey lines show the CON identification threshold from Falstad et al. (2021) on the x-axis and the corresponding τN on the y-axis.
Current usage metrics show cumulative count of Article Views (full-text article views including HTML views, PDF and ePub downloads, according to the available data) and Abstracts Views on Vision4Press platform.
Data correspond to usage on the plateform after 2015. The current usage metrics is available 48-96 hours after online publication and is updated daily on week days.
Initial download of the metrics may take a while.