Fig. 6.
Download original image
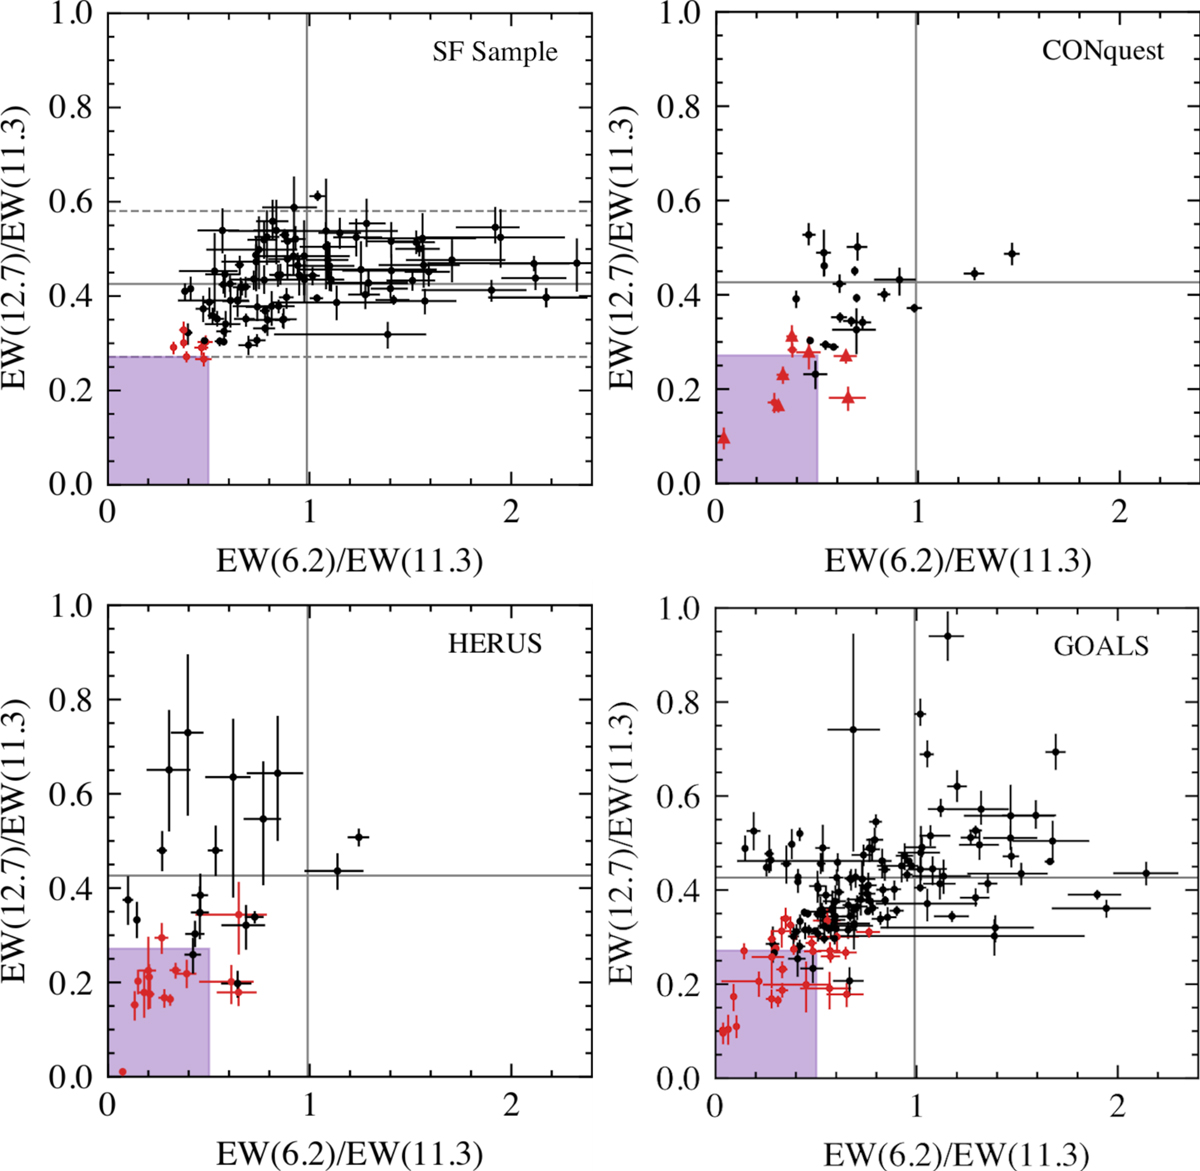
PAH EW diagram (García-Bernete et al. 2022a) of the 12.7/11.3 PAH features against the 6.2/11.3 PAH features obtained from fitting the star-forming sample (top left; Hernán-Caballero et al. 2020), CONquest (top right; Falstad et al. 2021), HERUS (bottom left; Farrah et al. 2013), and GOALS (bottom right; Armus et al. 2009). Points in red have a nuclear optical depth τN > 3.5, and for the CONquest sample the triangle points are those identified as CONs by ΣHCN-vib > 1 L⊙ pc−2. The grey lines show the mean values for the star-forming sample, with the 2σ values for the 12.7/11.3 PAH shown by the dashed lines. The purple shaded area shows the CON selection region.
Current usage metrics show cumulative count of Article Views (full-text article views including HTML views, PDF and ePub downloads, according to the available data) and Abstracts Views on Vision4Press platform.
Data correspond to usage on the plateform after 2015. The current usage metrics is available 48-96 hours after online publication and is updated daily on week days.
Initial download of the metrics may take a while.