Fig. 4.
Download original image
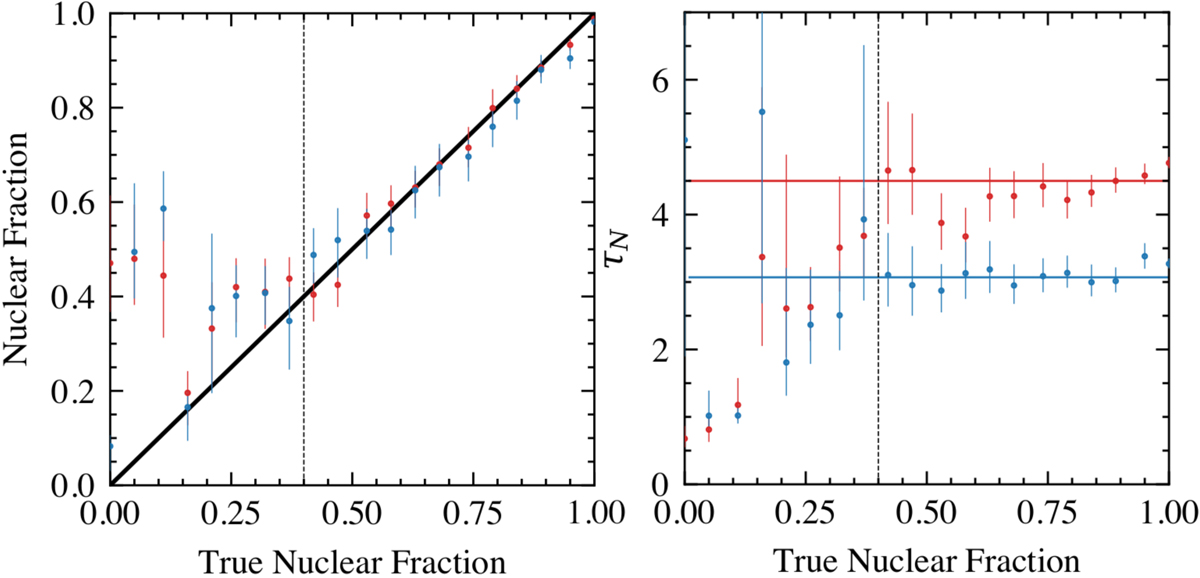
Testing the recovered properties of simulated data using the spectral decomposition fitting method. Left: measured nuclear fraction, β, against the true value. The solid black line shows where the measured equals the true value. Right: measured nuclear optical depth, τN, against the true nuclear fraction. The solid horizontal lines show the true optical depth of τN = 4.5 in red and τN = 3.0 in blue. The vertical dashed black lines show a cutoff of β = 0.4, below which the measured values become unreliable.
Current usage metrics show cumulative count of Article Views (full-text article views including HTML views, PDF and ePub downloads, according to the available data) and Abstracts Views on Vision4Press platform.
Data correspond to usage on the plateform after 2015. The current usage metrics is available 48-96 hours after online publication and is updated daily on week days.
Initial download of the metrics may take a while.