Fig. 3.
Download original image
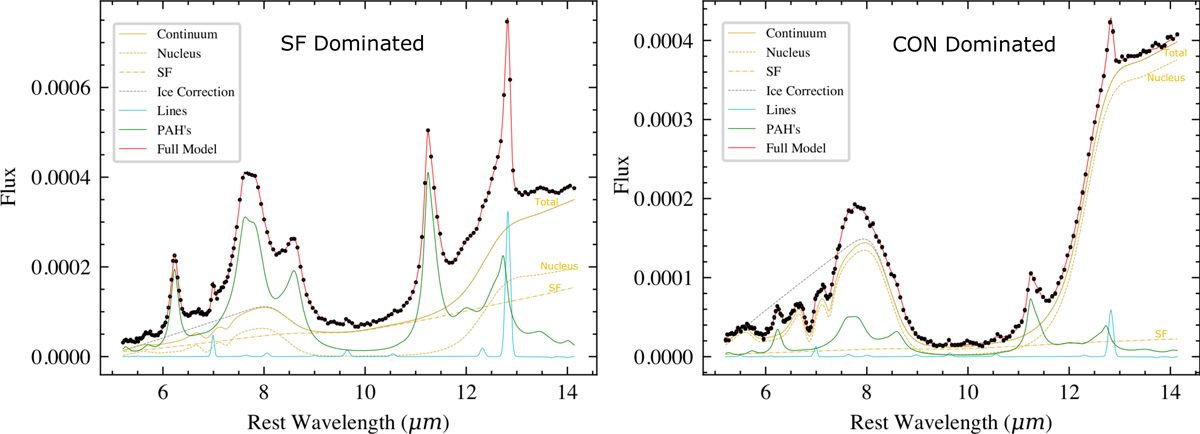
Example of our spectral decomposition fit (described in Sect. 3) to simulated data of a galaxy that hosts a CON. The left panel shows a highly diluted nucleus (β = 0.42) with a spectrum dominated by star formation, and the right panel shows a CON-dominated source (β = 0.89). The full model, shown in red, is composed of the various components shown in the legend. The continuum is shown as the solid gold line and is a sum of the nuclear and star-forming (SF) components, which are shown as dashed lines. The flux is in arbitrary units. The equation of the full model is given in Eq. (1).
Current usage metrics show cumulative count of Article Views (full-text article views including HTML views, PDF and ePub downloads, according to the available data) and Abstracts Views on Vision4Press platform.
Data correspond to usage on the plateform after 2015. The current usage metrics is available 48-96 hours after online publication and is updated daily on week days.
Initial download of the metrics may take a while.