Open Access
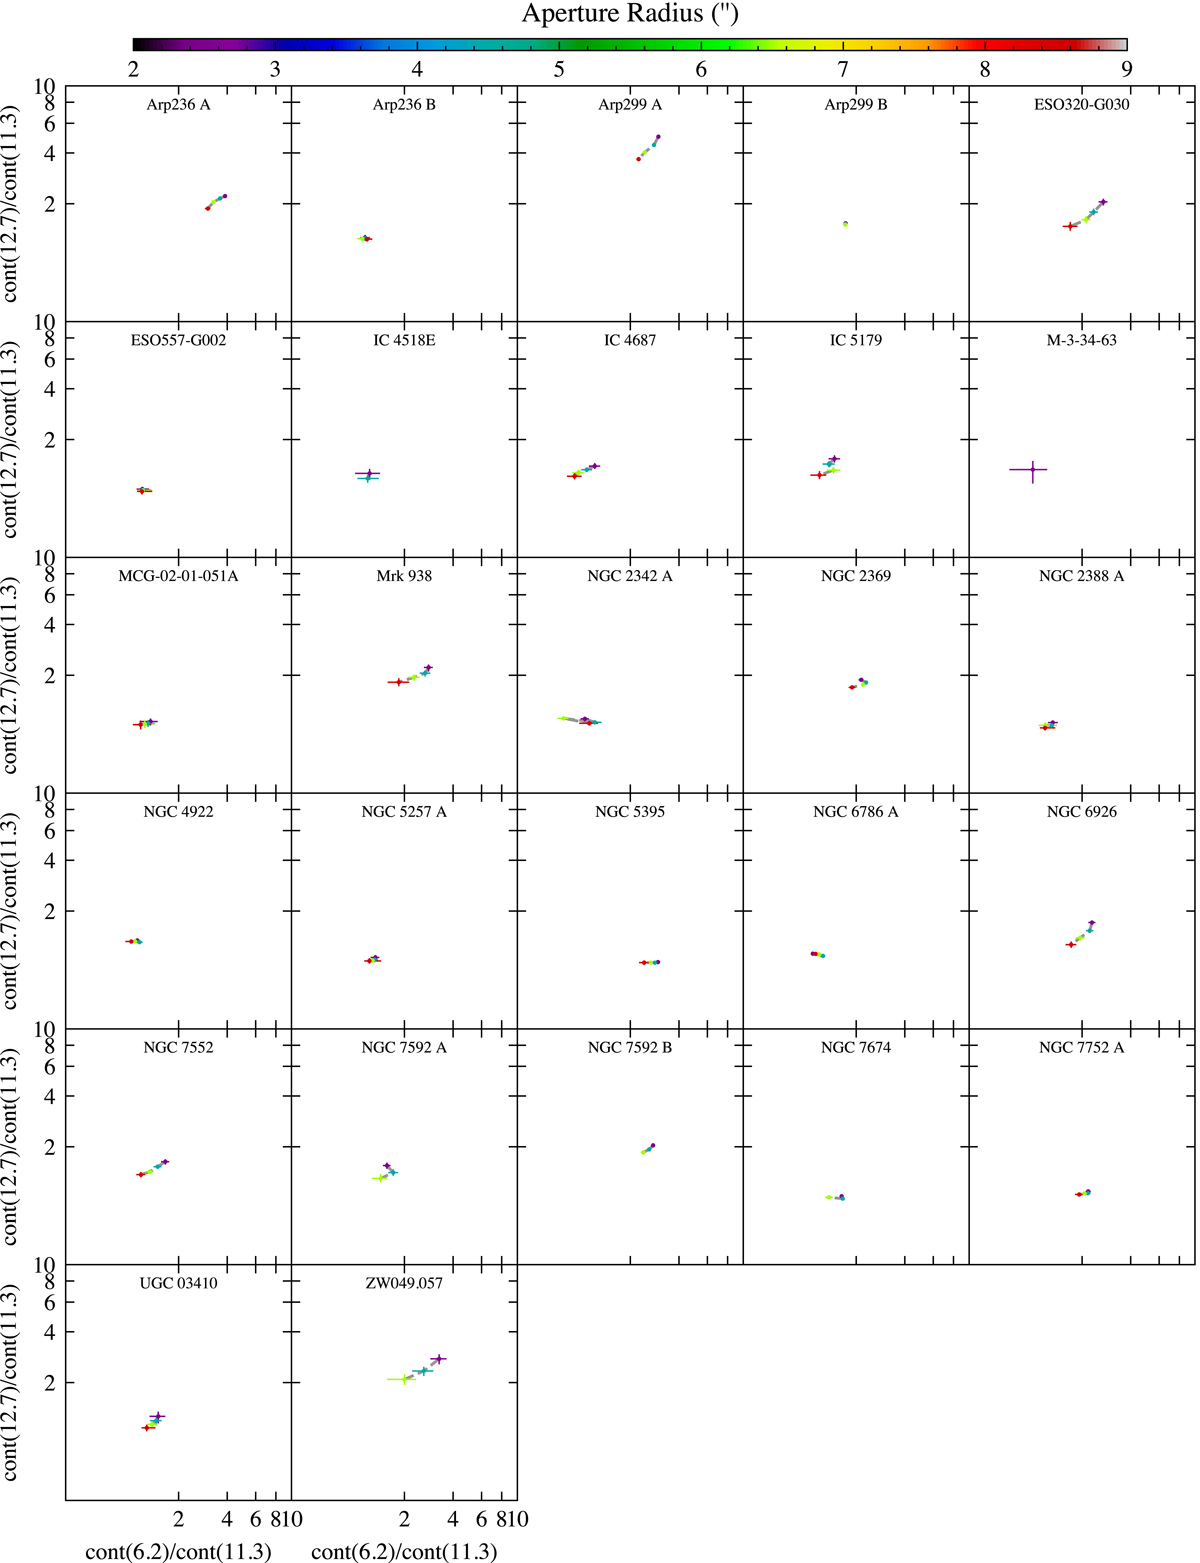
Fig. D.1.
Download original image
Continuum ratios at 12.7 μm to 11.3 μm against the 6.2/11.3 continuum ratio for the spectral mapping sample. For each galaxy, values are coloured by the aperture radius used to extract the spectra; a larger aperture will contain more emission from star formation in the galactic disc.
Current usage metrics show cumulative count of Article Views (full-text article views including HTML views, PDF and ePub downloads, according to the available data) and Abstracts Views on Vision4Press platform.
Data correspond to usage on the plateform after 2015. The current usage metrics is available 48-96 hours after online publication and is updated daily on week days.
Initial download of the metrics may take a while.