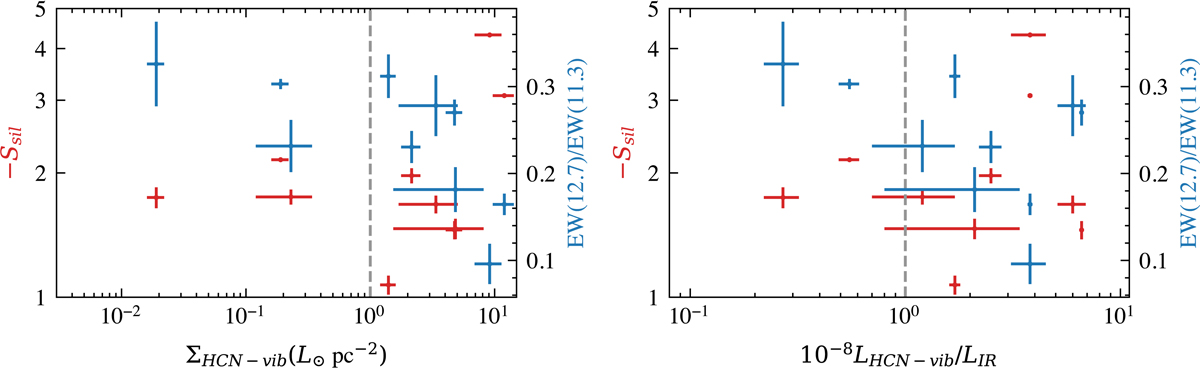
Fig. C.1.
Download original image
Same as Fig. 7 but with the apparent silicate strength as calculated by Eq. 6 (red), which shows no trend. The 12.7/11.3 PAH EW ratio is also shown (blue) against HCN-vib on the right-hand axis of each plot and shows a very weak trend. A comparison with Fig. 7 shows the value in accounting for the star-forming contribution to properly recover properties of the obscured nucleus.
Current usage metrics show cumulative count of Article Views (full-text article views including HTML views, PDF and ePub downloads, according to the available data) and Abstracts Views on Vision4Press platform.
Data correspond to usage on the plateform after 2015. The current usage metrics is available 48-96 hours after online publication and is updated daily on week days.
Initial download of the metrics may take a while.