Fig. 1.
Download original image
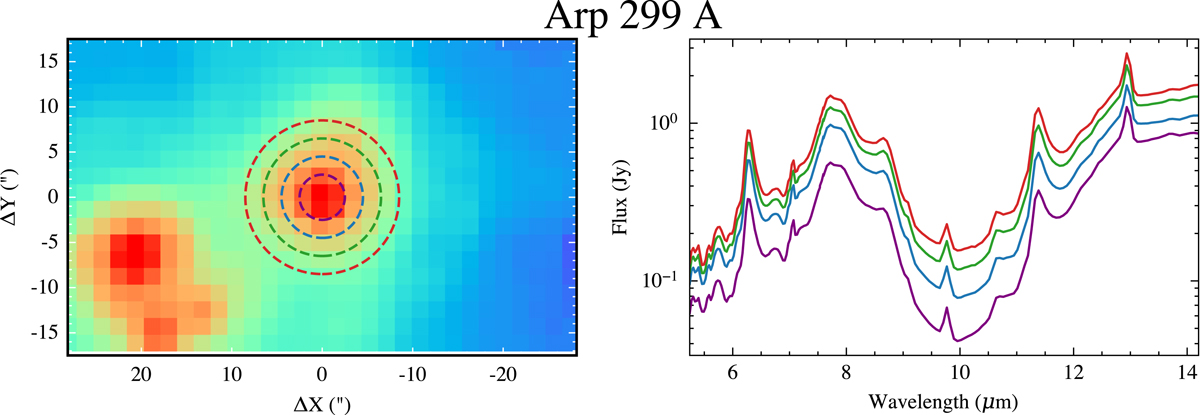
Example of the spectral extraction, in this case for Arp 299 A, at different spatial scales. Left: integrated intensity map of the SL1 cube (7.46–14.29 μm) overlaid with circular apertures of radii 2.5, 4.5, 6.5, and 8.5″, shown as the dashed lines. Right: extracted spectra from the apertures in the left panel with the corresponding colour. The innermost spectrum (purple) has had an aperture correction applied.
Current usage metrics show cumulative count of Article Views (full-text article views including HTML views, PDF and ePub downloads, according to the available data) and Abstracts Views on Vision4Press platform.
Data correspond to usage on the plateform after 2015. The current usage metrics is available 48-96 hours after online publication and is updated daily on week days.
Initial download of the metrics may take a while.