Fig. 7
Download original image
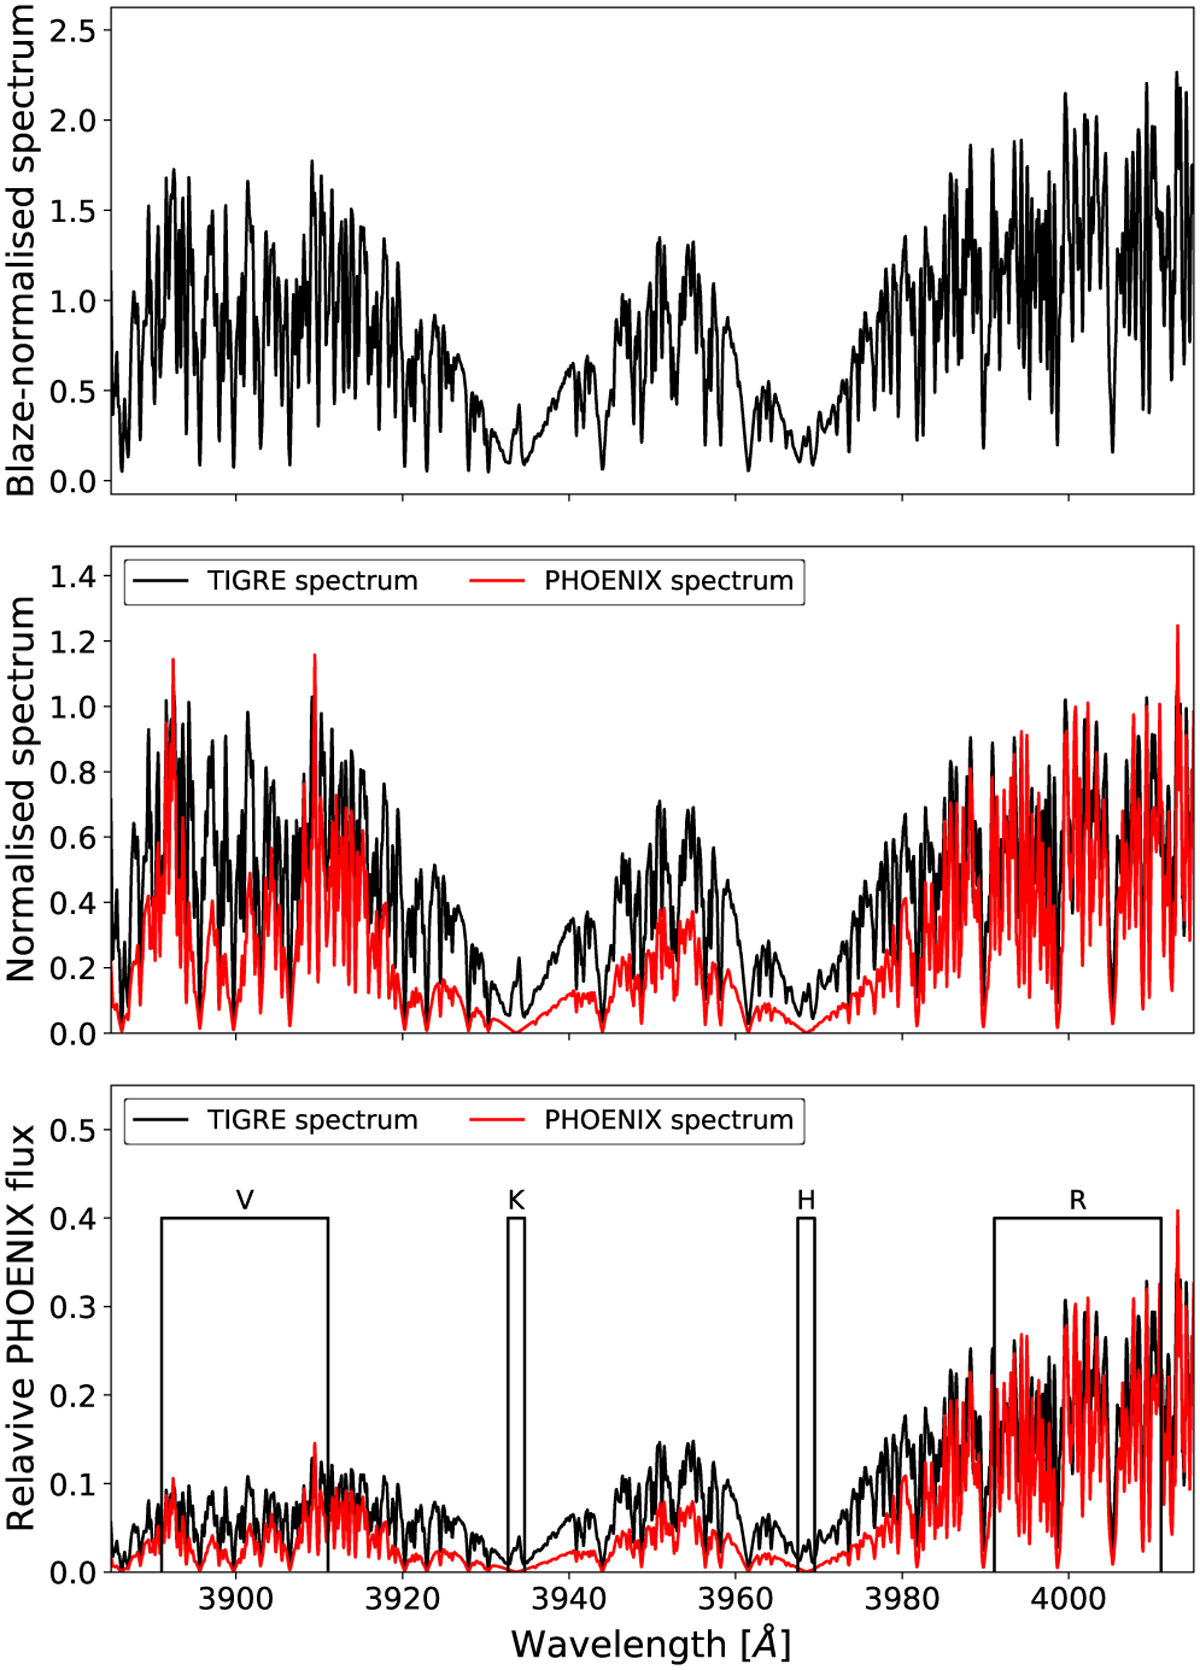
Steps of the re-normalisation of spectra for TIGRE SII_MWO estimation: upper panel shows the Ca II H&K region of HD 29139 taken with TIGRE on December 27 2019; the middle panel shows the continuum-normalised spectra of the TIGRE spectrum as a black line and the selected and continuum-normalised PHOENIX spectrum as a red line, and the lower panel shows the re-normalised TIGRE spectrum as a black line and the PHOENIX spectrum in a relative flux scale (flux divided by the maximal flux).
Current usage metrics show cumulative count of Article Views (full-text article views including HTML views, PDF and ePub downloads, according to the available data) and Abstracts Views on Vision4Press platform.
Data correspond to usage on the plateform after 2015. The current usage metrics is available 48-96 hours after online publication and is updated daily on week days.
Initial download of the metrics may take a while.