Fig. 20
Download original image
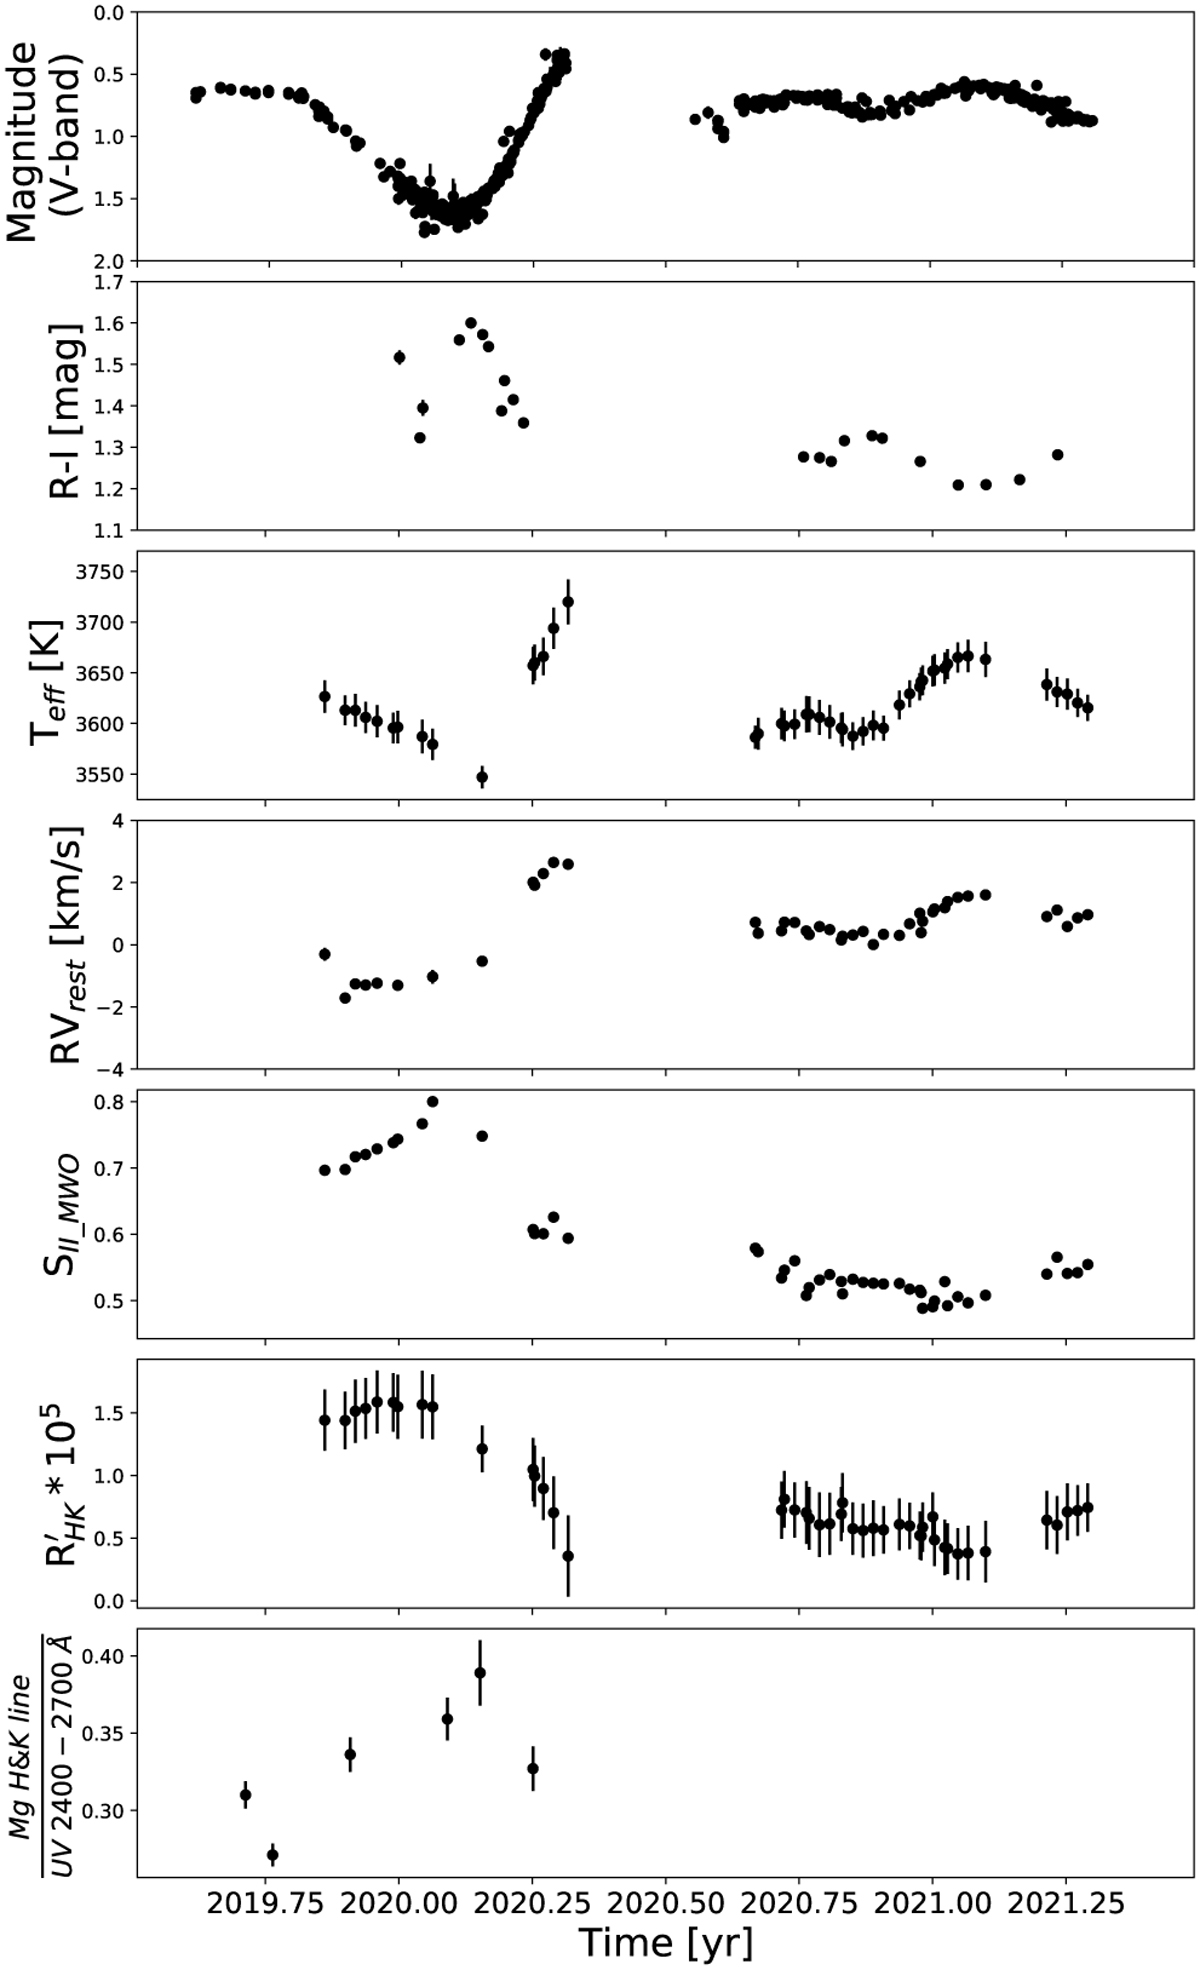
Summary of the time series to show the main variation results. From top to bottom, we show the V-band, R – I colour index, the effective temperature, the RVrest variation of the Ti I line at 6261.1 A and the TIGRE SII_MWO, the ![]() , and the ratio between the absolute Mg II h&k line flux and the MUV flux in 2400–2700 Å shown in Dupree et al. (2020).
, and the ratio between the absolute Mg II h&k line flux and the MUV flux in 2400–2700 Å shown in Dupree et al. (2020).
Current usage metrics show cumulative count of Article Views (full-text article views including HTML views, PDF and ePub downloads, according to the available data) and Abstracts Views on Vision4Press platform.
Data correspond to usage on the plateform after 2015. The current usage metrics is available 48-96 hours after online publication and is updated daily on week days.
Initial download of the metrics may take a while.