Open Access
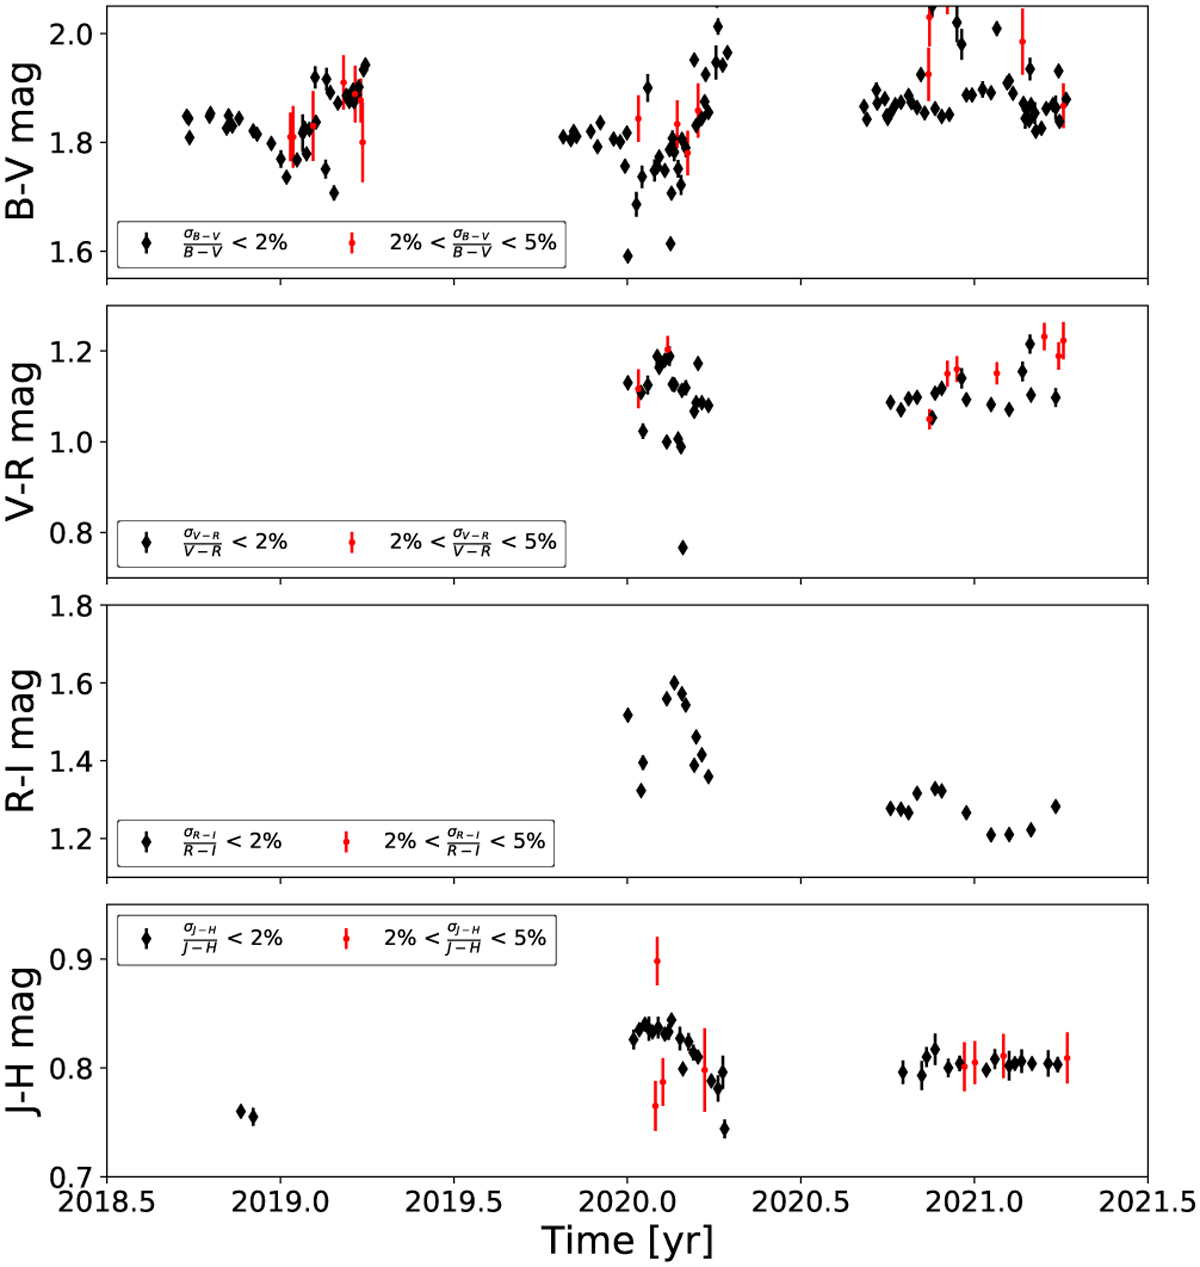
Fig. 2
Download original image
Colour index time series. The top panel shows the B − V values, the second displays the V − R values, the third the R − I values, and the lowest panel depicts the H − J values. Black dots represent values with a relative error of lower than 2%, whereas red data points those lower than 5%.
Current usage metrics show cumulative count of Article Views (full-text article views including HTML views, PDF and ePub downloads, according to the available data) and Abstracts Views on Vision4Press platform.
Data correspond to usage on the plateform after 2015. The current usage metrics is available 48-96 hours after online publication and is updated daily on week days.
Initial download of the metrics may take a while.