Open Access
Fig. 10
Download original image
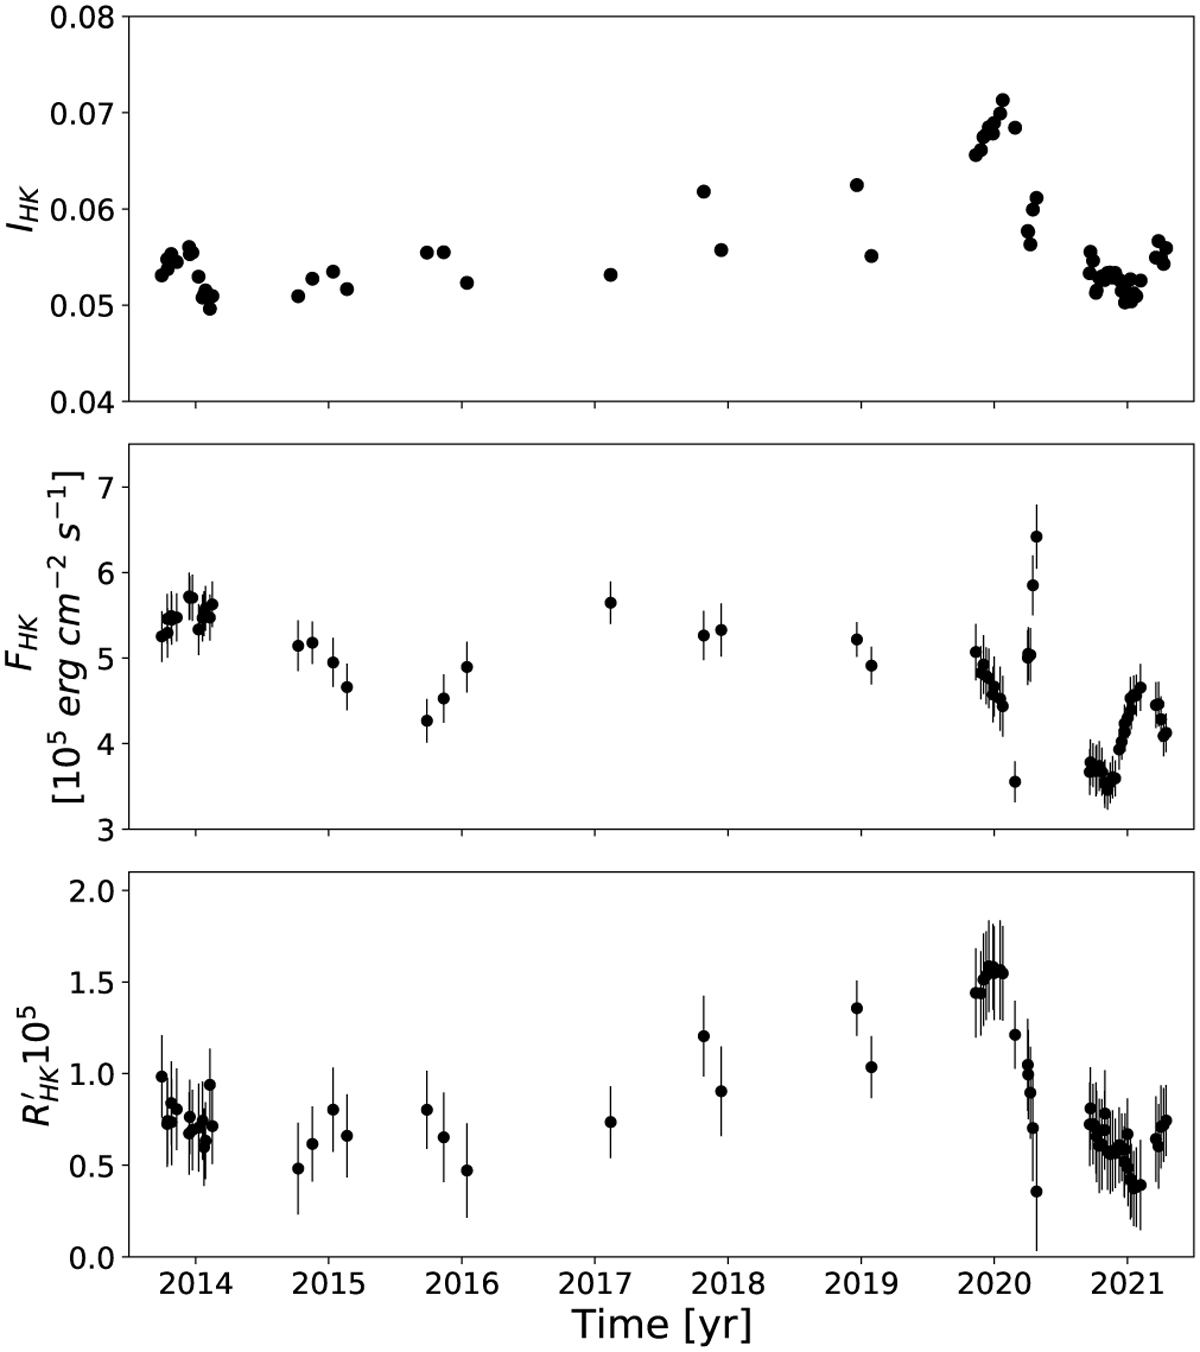
Ca II H&K fluxes in relative and absolute flux scale: upper panel shows the count ratio IHK vs. time, middle panel the estimated absolute Ca II H&K flux, and the lower panel the estimated Ca II H&K flux excess ![]() .
.
Current usage metrics show cumulative count of Article Views (full-text article views including HTML views, PDF and ePub downloads, according to the available data) and Abstracts Views on Vision4Press platform.
Data correspond to usage on the plateform after 2015. The current usage metrics is available 48-96 hours after online publication and is updated daily on week days.
Initial download of the metrics may take a while.