Fig. 9
Download original image
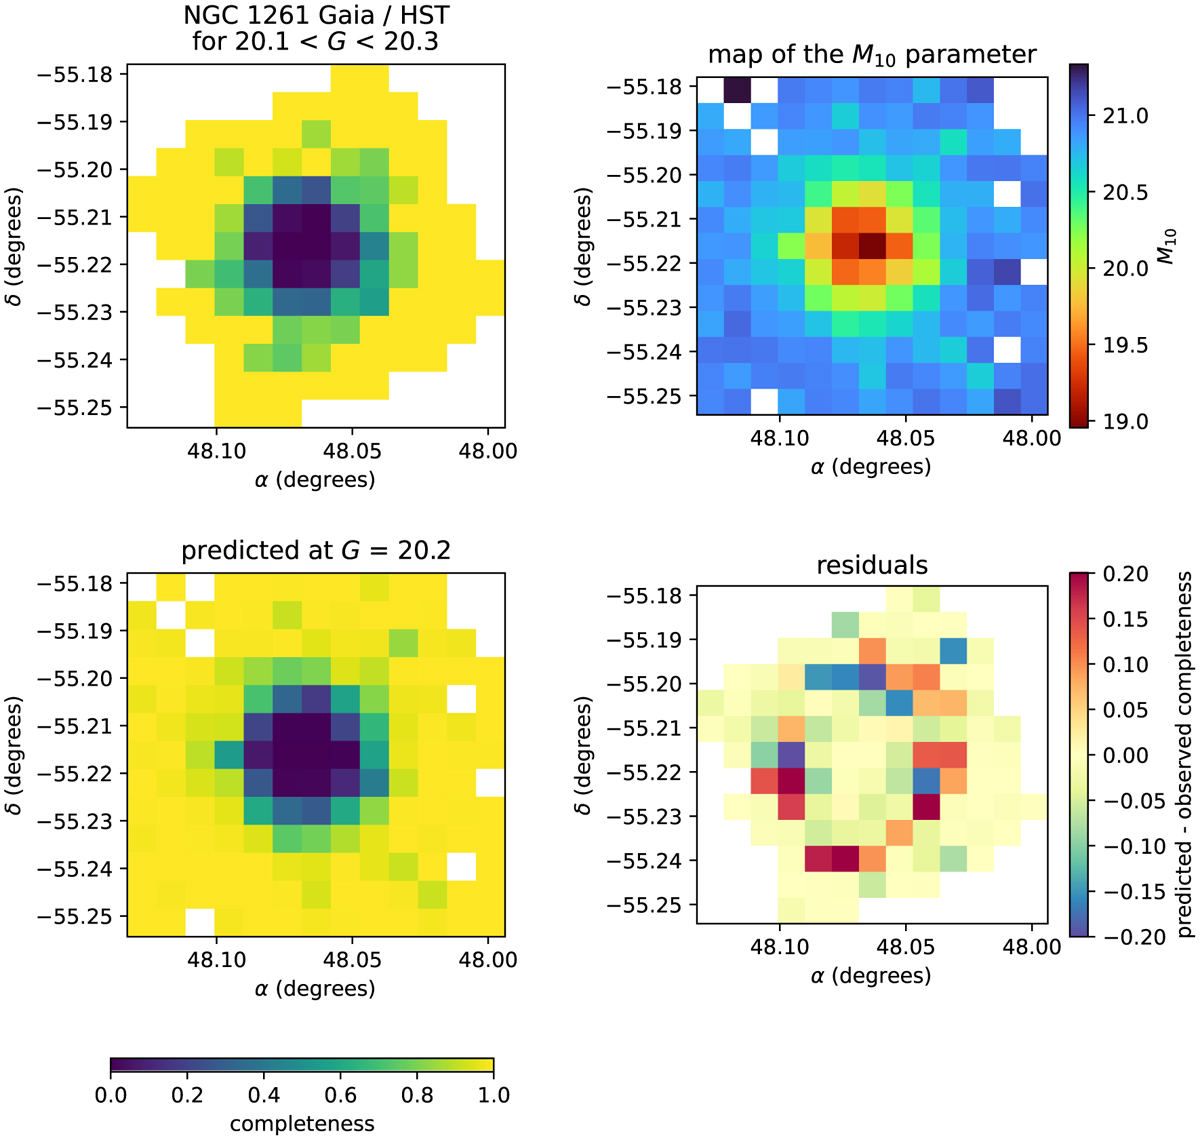
Comparison of the direct (empirical) and model-predicted completeness maps, illustrated for the globular cluster NGC 1261. Top left: map ratio of the number of sources in Gaia and HST in the magnitude range 20.9 < G < 21.1. Top left: map of M10 used to predict the completeness. Bottom left: predicted completeness at G = 21. Bottom right: map of the difference between the predicted and observed completeness: the variance is largest in the intermediate completeness regime (see Fig. 5), producing a ring-like structure in the residuals map.
Current usage metrics show cumulative count of Article Views (full-text article views including HTML views, PDF and ePub downloads, according to the available data) and Abstracts Views on Vision4Press platform.
Data correspond to usage on the plateform after 2015. The current usage metrics is available 48-96 hours after online publication and is updated daily on week days.
Initial download of the metrics may take a while.