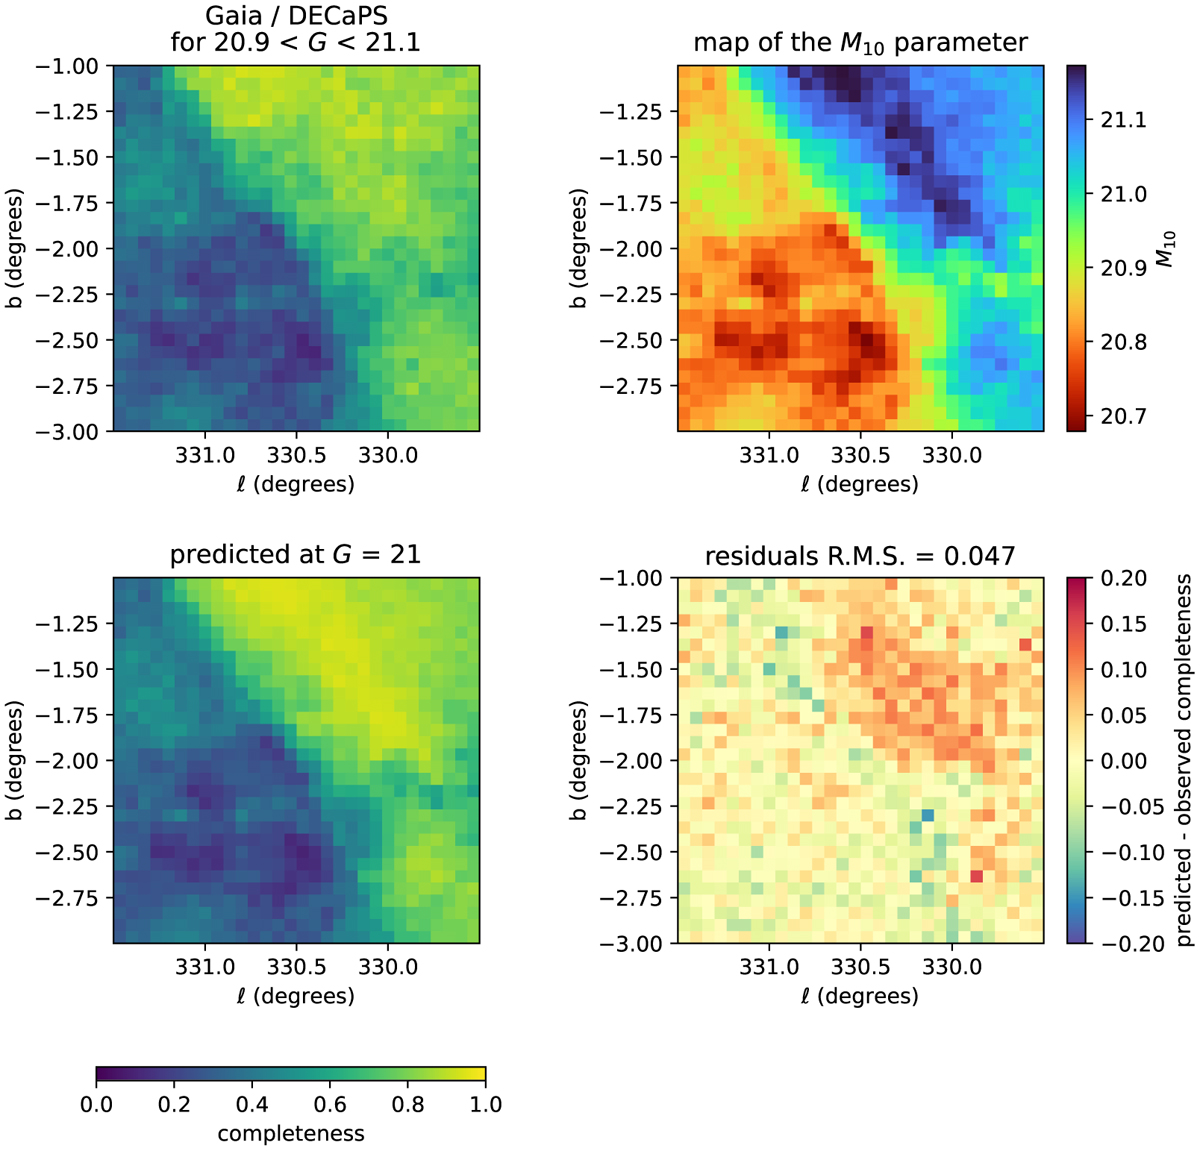
Fig. 7
Download original image
Comparison of the direct, empirical and model-predicted completeness maps, illustrated at G ~ 21. Top left: map of the direct completeness estimate, i.e. the ratio of source densities in Gaia and DECaPS in the magnitude range 20.9 < G < 21.1. Top right: map of the quantity M10 used to predict the model completeness. Bottom left: completeness at G = 21 predicted from the M10 map and the model of Eq. (1). Bottom right: map of the difference between the predicted and observed completenesses. We note that using more external information, the model-predicted completeness map (bottom left) is effectively a de-noised version of the empirical completeness map (top left).
Current usage metrics show cumulative count of Article Views (full-text article views including HTML views, PDF and ePub downloads, according to the available data) and Abstracts Views on Vision4Press platform.
Data correspond to usage on the plateform after 2015. The current usage metrics is available 48-96 hours after online publication and is updated daily on week days.
Initial download of the metrics may take a while.