Fig. 5
Download original image
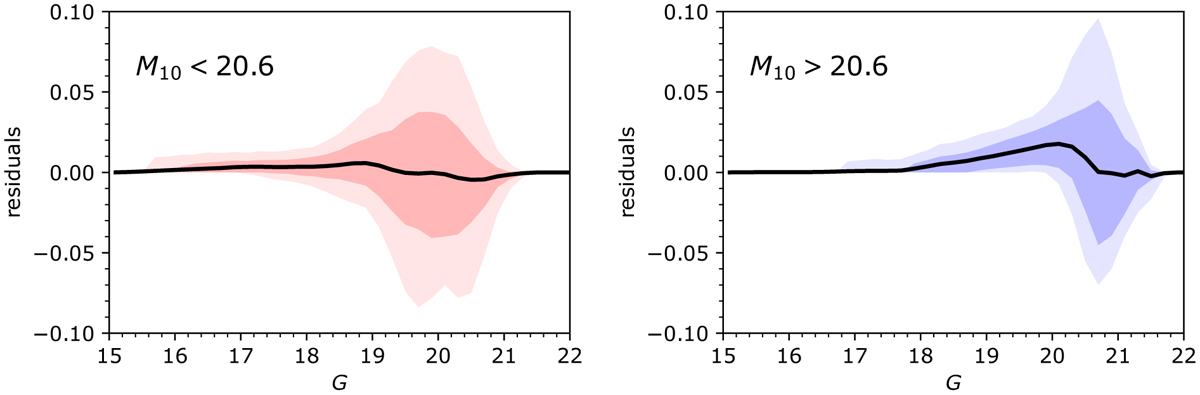
Mean completeness residuals, i.e. model predicted minus observed completeness, as a function of magnitude, for patches in two different ranges of M10. The shaded areas correspond to the 16th to 84th percentile and 5th to 95th percentile intervals. Expectedly, the residuals are highest near 50% completeness and smaller in the highly complete or dramatically incomplete regime.
Current usage metrics show cumulative count of Article Views (full-text article views including HTML views, PDF and ePub downloads, according to the available data) and Abstracts Views on Vision4Press platform.
Data correspond to usage on the plateform after 2015. The current usage metrics is available 48-96 hours after online publication and is updated daily on week days.
Initial download of the metrics may take a while.