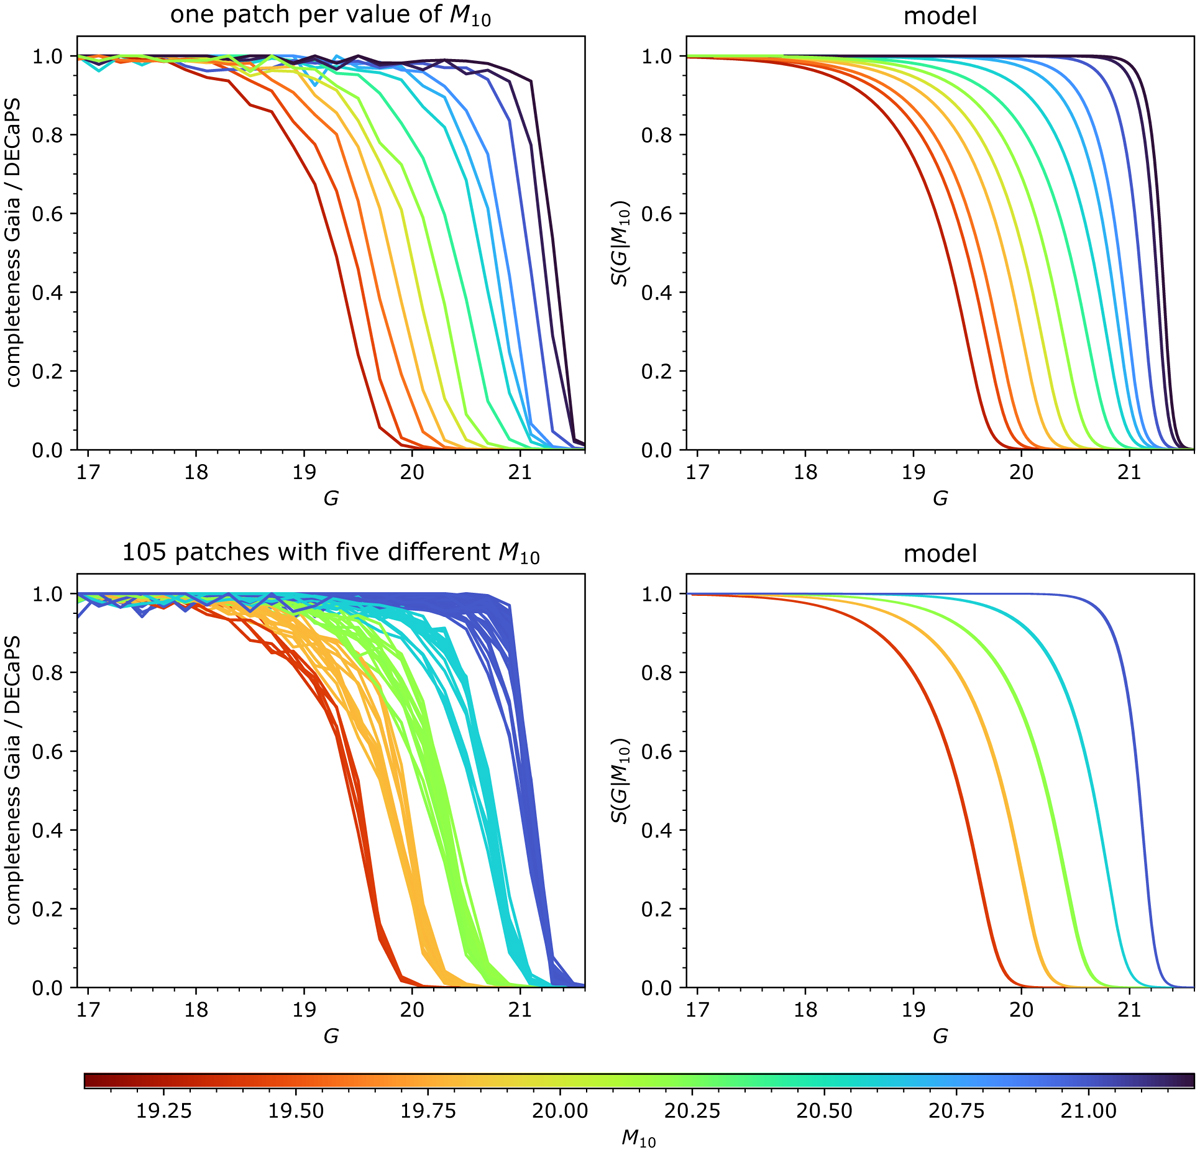
Fig. 3
Download original image
Gaia’s catalogue completeness S(G | M10) as a function of G magnitude for a given completeness parameter M10. Top left: empirically determined Gaia G completeness derived from the comparison with DECaPS photometry in thirteen DECaPS patches that are each colour-coded by their M10. Top right: model completeness, from Eq. (1), for the corresponding M10 values. Bottom left: empirically determined completeness derived from the comparison with DECaPS photometry in 105 DECaPS patches with M10=19.4, 19.8, 20.2, 20.6, and 21 (within 0.01 mag). The dispersion at a given M10 corresponds to the scatter seen in Fig. 1 (right panel) and the residuals in Fig. 5. Bottom right: model completeness for these five values of M10.
Current usage metrics show cumulative count of Article Views (full-text article views including HTML views, PDF and ePub downloads, according to the available data) and Abstracts Views on Vision4Press platform.
Data correspond to usage on the plateform after 2015. The current usage metrics is available 48-96 hours after online publication and is updated daily on week days.
Initial download of the metrics may take a while.