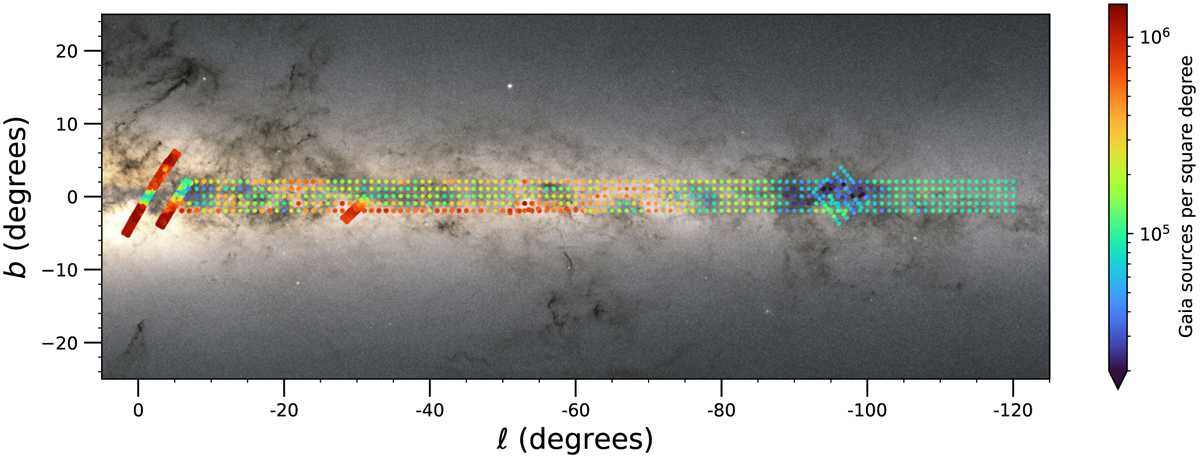
Fig. C.1
Download original image
Location of the 1085 patches of sky (some of which are further divided into smaller patches for a total of 2906) used to compute Gaia-to-DECaPS source ratios and calibrate our model. Their observed (Gaia) source densities range from ~4000 to ~1.4 million sources per square degree. The background map is the integrated Gaia flux map (ESA/Gaia DPAC).
Current usage metrics show cumulative count of Article Views (full-text article views including HTML views, PDF and ePub downloads, according to the available data) and Abstracts Views on Vision4Press platform.
Data correspond to usage on the plateform after 2015. The current usage metrics is available 48-96 hours after online publication and is updated daily on week days.
Initial download of the metrics may take a while.