Open Access
Fig. B.1
Download original image
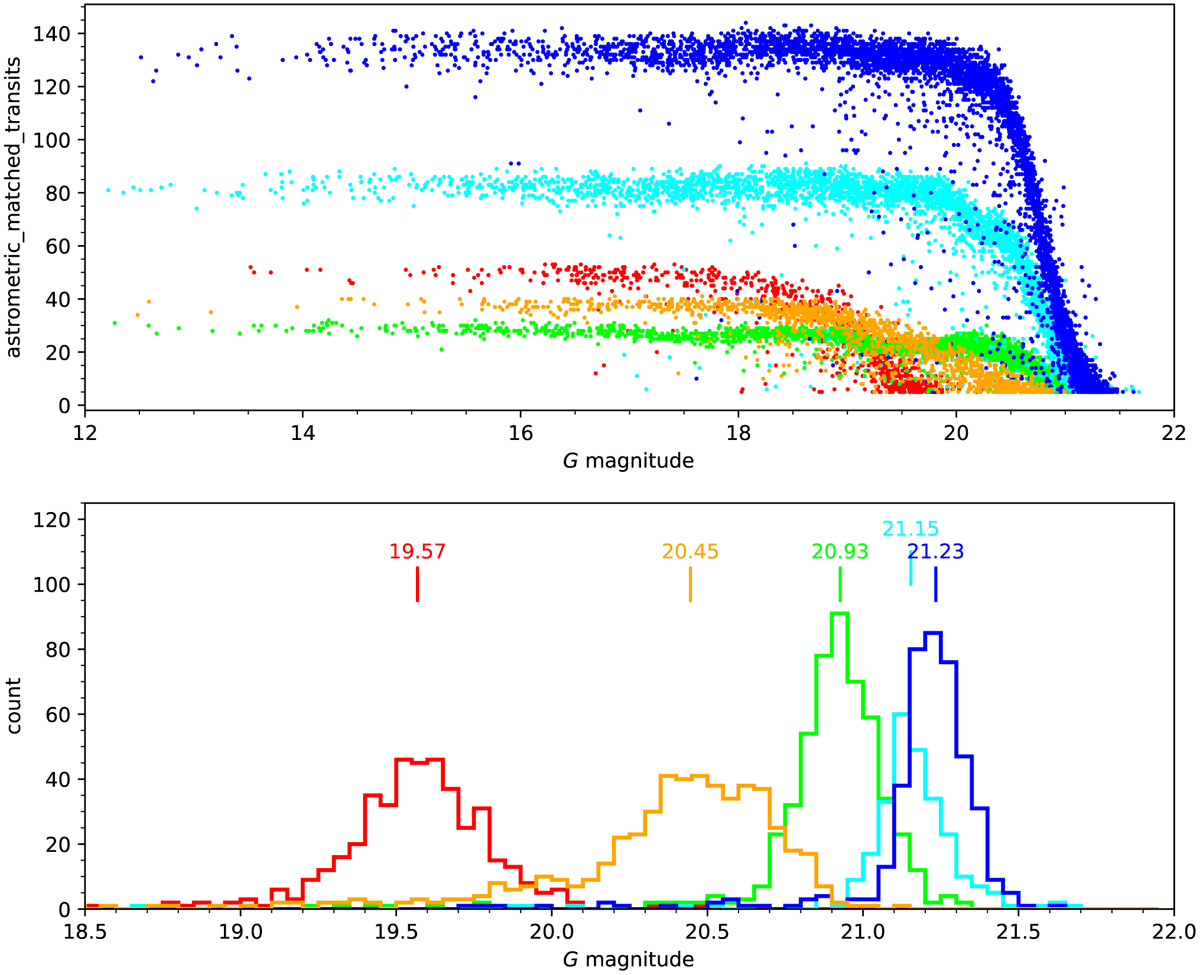
Distribution of number of matched transits with magnitude and sky position. Top: number of astrometric_matched_transits against magnitude for sources in five selected regions. Bottom: magnitude distribution of the sources with astrometric_matched_transits ≤10, and their median magnitude M10.
Current usage metrics show cumulative count of Article Views (full-text article views including HTML views, PDF and ePub downloads, according to the available data) and Abstracts Views on Vision4Press platform.
Data correspond to usage on the plateform after 2015. The current usage metrics is available 48-96 hours after online publication and is updated daily on week days.
Initial download of the metrics may take a while.