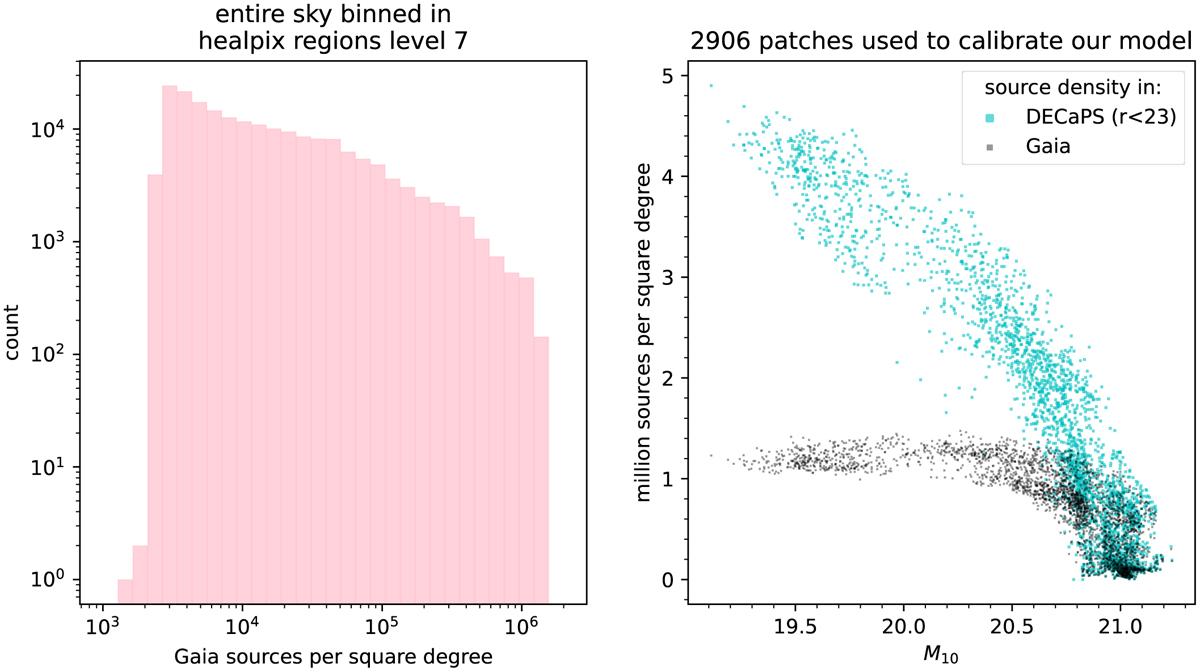
Fig. A.1
Download original image
Left: distribution of Gaia DR3 sources densities computed in 196,608 HEALPix regions level 7 across the whole sky. Crowding artificially sets an upper limit of the catalogue source density. Right: source density as a function of M10 in Gaia DR3 (black) and DECaPS with r<23 (cyan) in the 2906 patches we use to calibrate our model (see Fig. C.1). Outside the sparsest regions, the Gaia source density provides almost no information on the true source density and level of crowding.
Current usage metrics show cumulative count of Article Views (full-text article views including HTML views, PDF and ePub downloads, according to the available data) and Abstracts Views on Vision4Press platform.
Data correspond to usage on the plateform after 2015. The current usage metrics is available 48-96 hours after online publication and is updated daily on week days.
Initial download of the metrics may take a while.