Fig. 10
Download original image
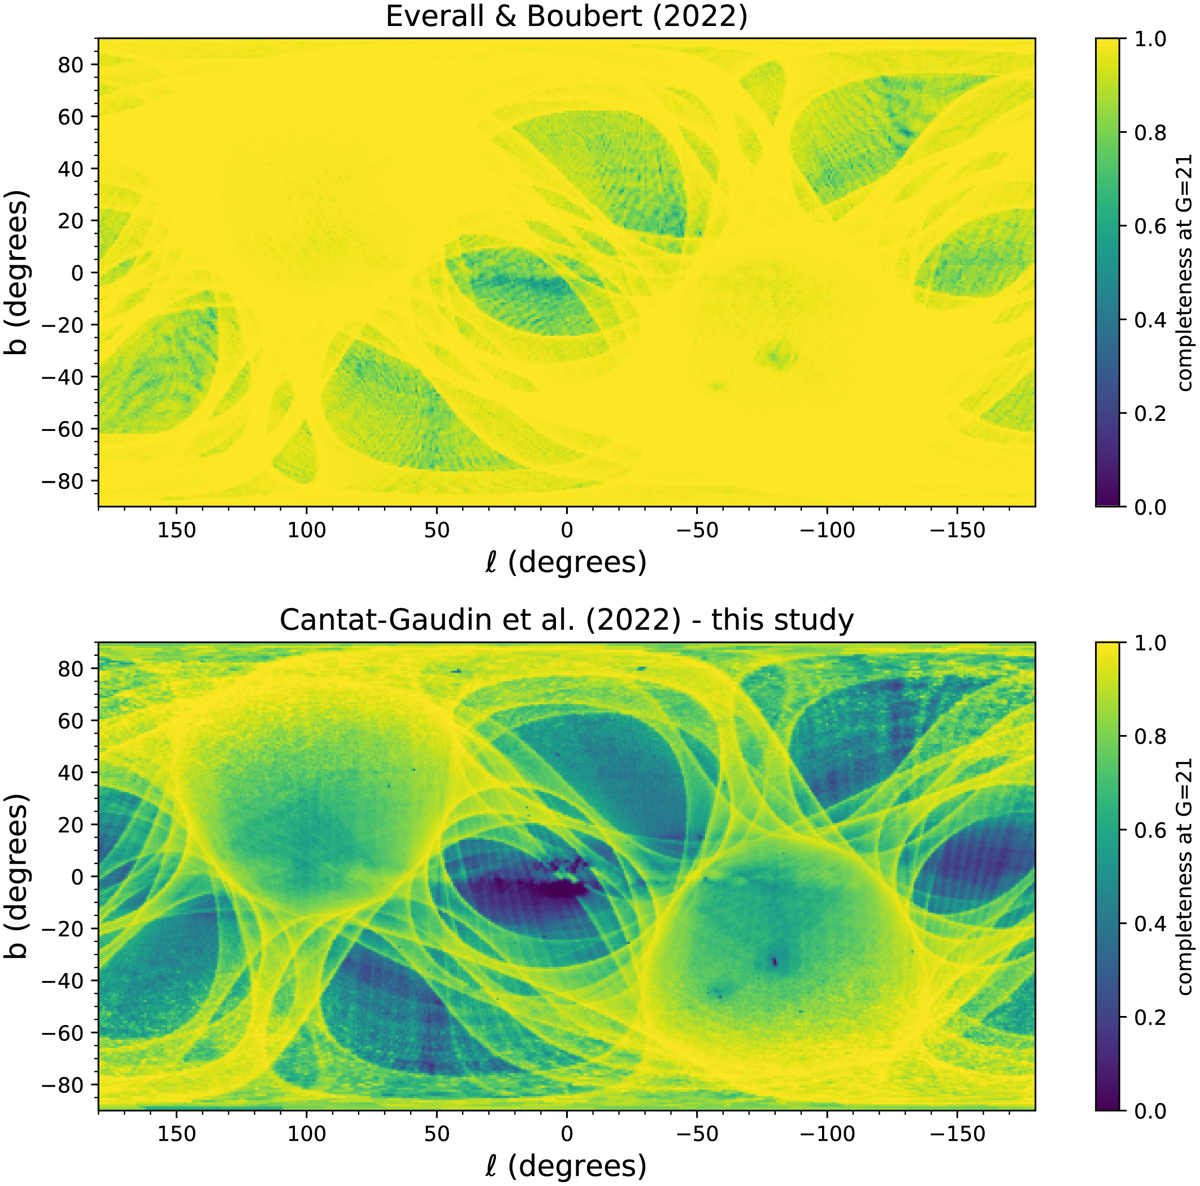
Global comparison of the completeness maps predicted by the ab initio completeness model (EB22, top panel), and our empirically derived M10-based completeness model (bottom panel). The overall morphology of the two maps is similar, but our empirical completeness model implies far greater incompleteness (at G = 21), especially in the regions of high source densities.
Current usage metrics show cumulative count of Article Views (full-text article views including HTML views, PDF and ePub downloads, according to the available data) and Abstracts Views on Vision4Press platform.
Data correspond to usage on the plateform after 2015. The current usage metrics is available 48-96 hours after online publication and is updated daily on week days.
Initial download of the metrics may take a while.