Open Access
Fig. 1
Download original image
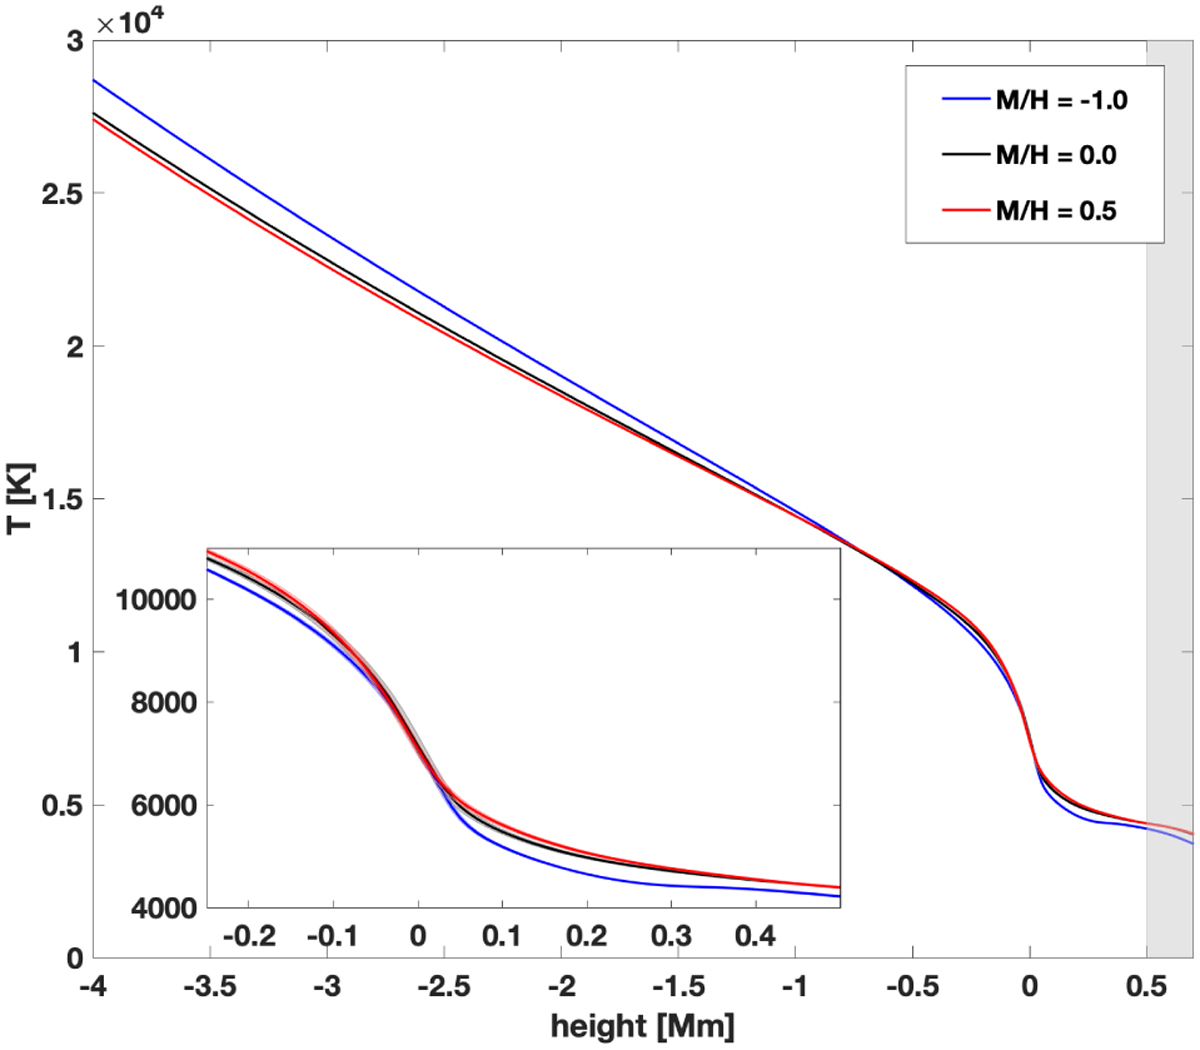
Horizontally and time averaged temperature structure of the SSD runs with height for different metallicity values. The grey shaded area shows the region that might be affected by the top boundary conditions (see detailed discussion in Sect. 2.3).
Current usage metrics show cumulative count of Article Views (full-text article views including HTML views, PDF and ePub downloads, according to the available data) and Abstracts Views on Vision4Press platform.
Data correspond to usage on the plateform after 2015. The current usage metrics is available 48-96 hours after online publication and is updated daily on week days.
Initial download of the metrics may take a while.