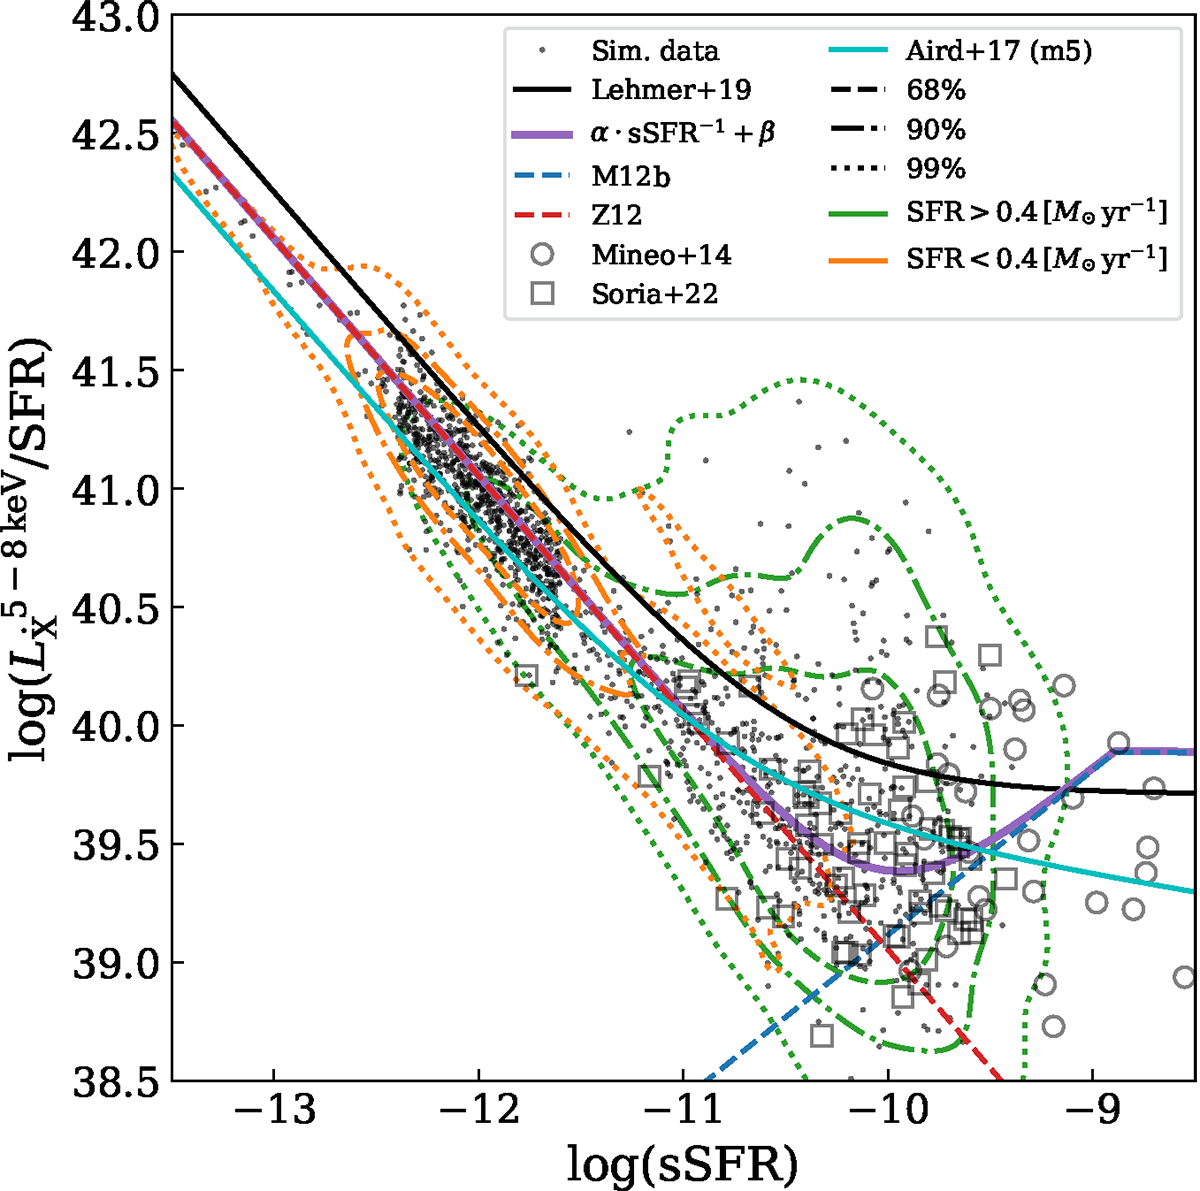
Fig. 9.
Download original image
Relation between SFR-normalized total X-ray luminosity (both XRB types) and sSFR, for star-forming galaxies in Box4of Magneticum (contours: percentiles). The solid black line is the relation of observed normal galaxies at z ∼ 0 from L16. The dash-dotted line represents the relation for a set of local galaxies from L19. The solid cyan line is the relation obtained from model 5 (m5) in Aird et al. (2017), where we fixed z = 0.01. The dashed red line depicts the expected scaling relation for a pure LMXB contribution given our XLF choice. The dashed blue line shows the expected broken SFR scaling relation of a pure HMXB contribution. Data points are taken from S22 and M14.
Current usage metrics show cumulative count of Article Views (full-text article views including HTML views, PDF and ePub downloads, according to the available data) and Abstracts Views on Vision4Press platform.
Data correspond to usage on the plateform after 2015. The current usage metrics is available 48-96 hours after online publication and is updated daily on week days.
Initial download of the metrics may take a while.