Open Access
Fig. 8.
Download original image
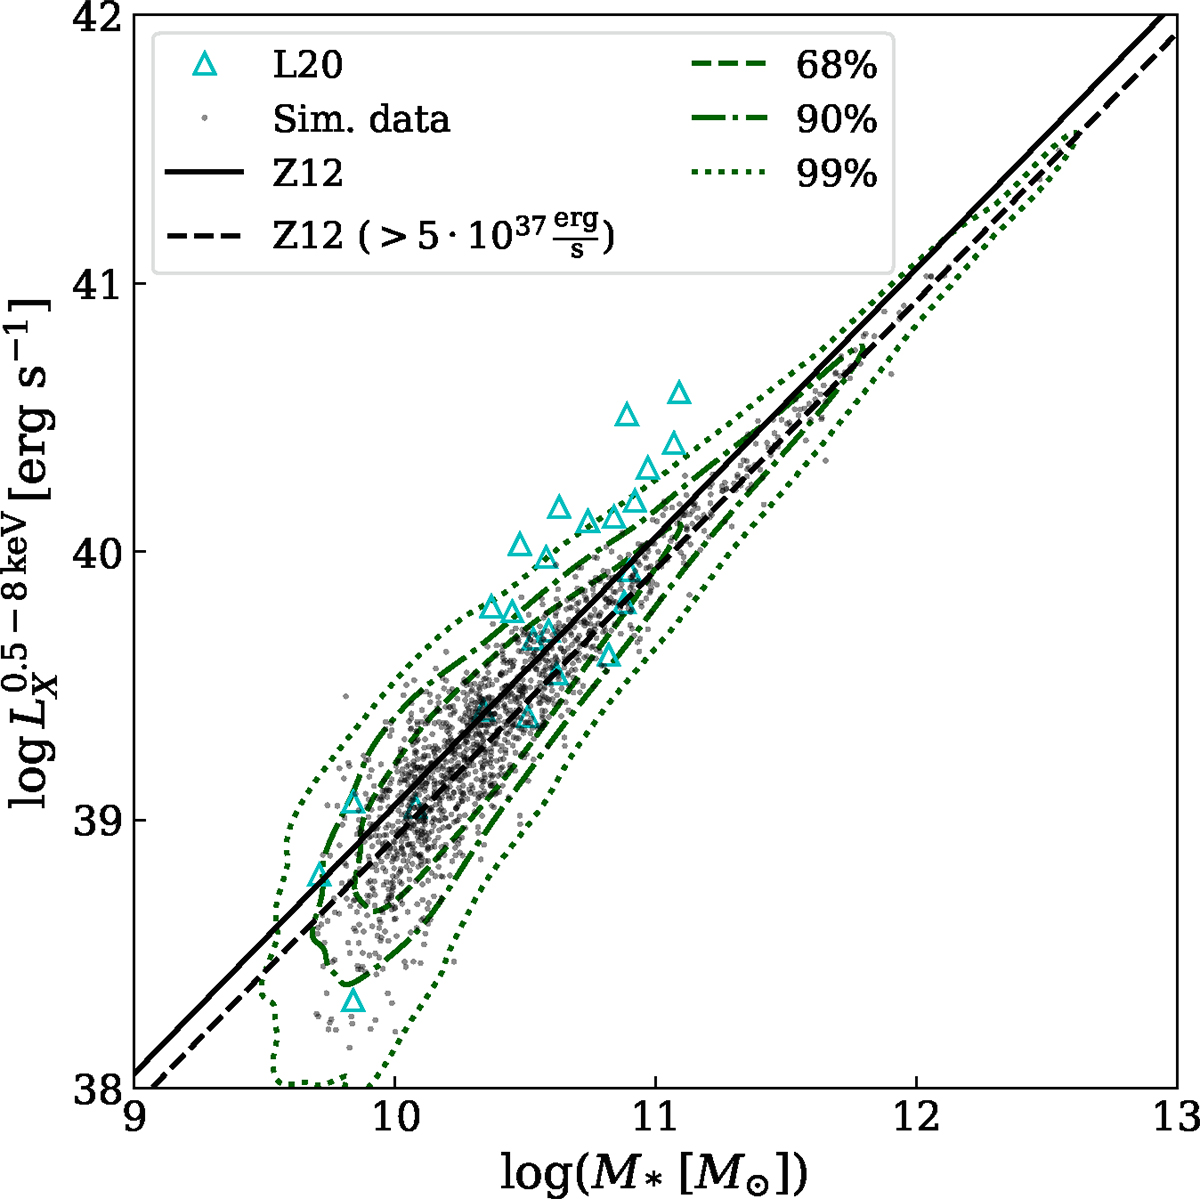
Same as Fig. 7, but for LMXB emission in the 0.5–8 keV band. The solid black line is the expected relation from the employed LMXB model in Eq. (1). The dashed black line is the same relation for a luminosity limit Lmin of 5 × 1037 erg s−1. Data points (cyan triangles) are taken from Lehmer et al. (2020).
Current usage metrics show cumulative count of Article Views (full-text article views including HTML views, PDF and ePub downloads, according to the available data) and Abstracts Views on Vision4Press platform.
Data correspond to usage on the plateform after 2015. The current usage metrics is available 48-96 hours after online publication and is updated daily on week days.
Initial download of the metrics may take a while.