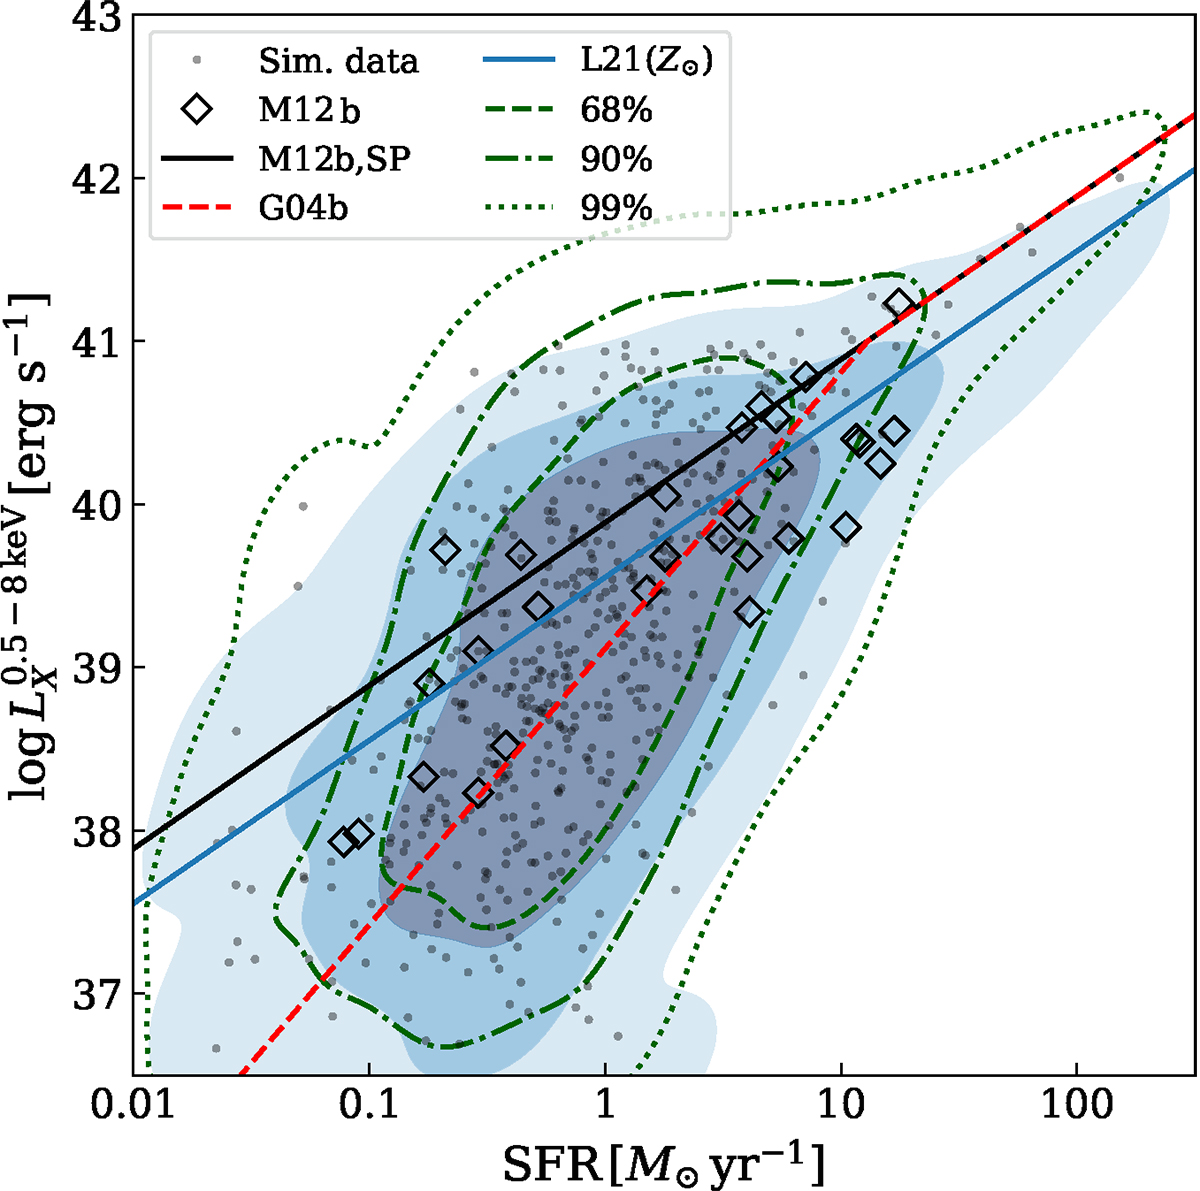
Fig. 7.
Download original image
Same as Fig. 6, but for HMXB luminosity in the 0.5–8 keV band. The filled blue contours represent the same halos with HMXBs sampled from the L21 model (Eq. (11)). The solid black line is the expected relation from the employed HMXB model in Eq. (3), and the dashed red line is the predicted relation for discretely sampling data points from a PL distribution (Gilfanov et al. 2004a). The solid blue line is the expected relation from the employed L21 model. Data points are taken from M12b.
Current usage metrics show cumulative count of Article Views (full-text article views including HTML views, PDF and ePub downloads, according to the available data) and Abstracts Views on Vision4Press platform.
Data correspond to usage on the plateform after 2015. The current usage metrics is available 48-96 hours after online publication and is updated daily on week days.
Initial download of the metrics may take a while.