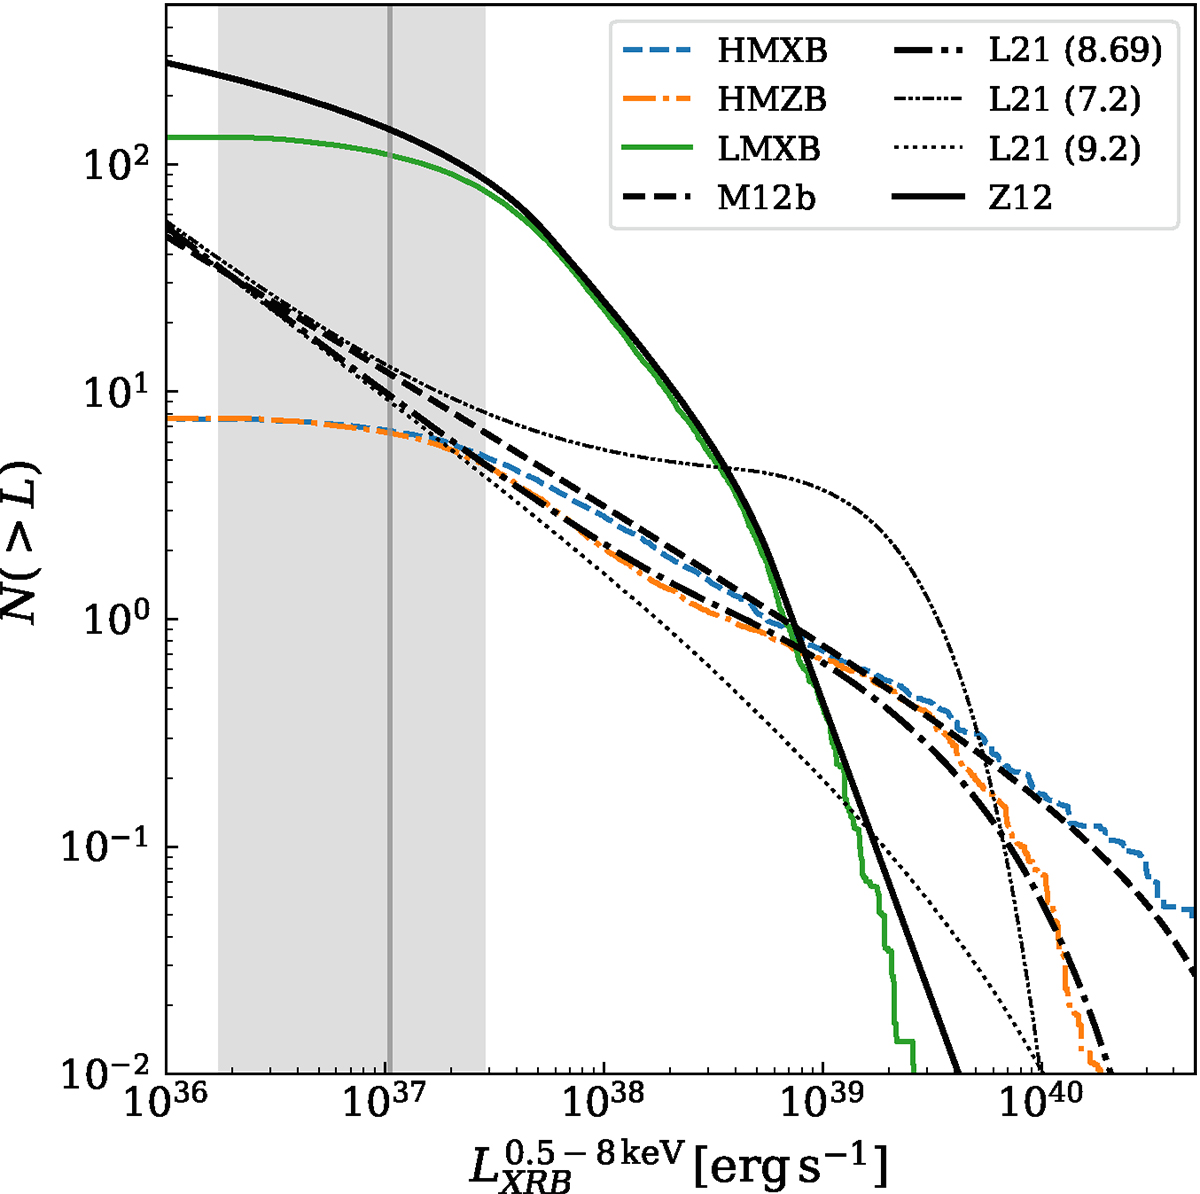
Fig. 5.
Download original image
Integrated XLFs from Eqs. (1), (3), and (11) normalized by their respective scaling (SFR and M*). The dash-dot-dotted line is the XLFs of the L21 model, for log[O/H]+12 = 7.2, and the dotted line for log[O/H]+12 = 9.2. Colored lines are average XLFs obtained from the luminosity sampling in PHOX: from M12b in dashed blue, L21 in dash-dotted orange, and Z12 in solid green. Corresponding lines share the same line style. The gray vertical line at log L ∼ 37 marks the maximum luminosity of a source emitting one single photon with an average energy of 0.5–8 keV.
Current usage metrics show cumulative count of Article Views (full-text article views including HTML views, PDF and ePub downloads, according to the available data) and Abstracts Views on Vision4Press platform.
Data correspond to usage on the plateform after 2015. The current usage metrics is available 48-96 hours after online publication and is updated daily on week days.
Initial download of the metrics may take a while.