Fig. 2.
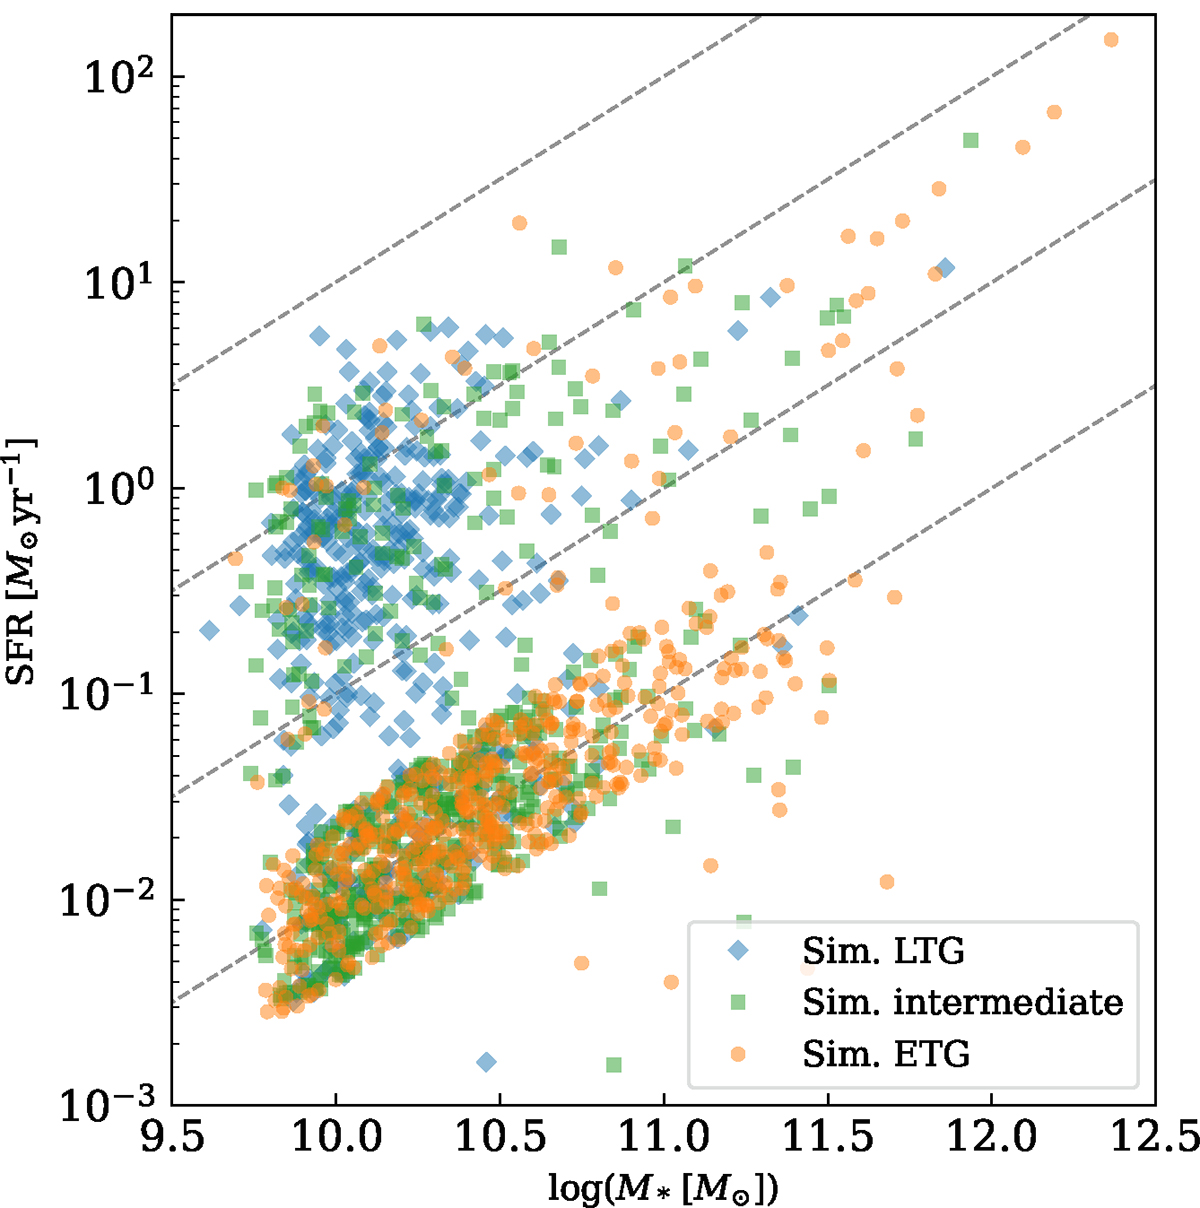
Download original image
SFR − M* relation of our sample. The dashed diagonal lines correspond to constant logsSFR of −9 (top) to −12 (bottom) in increments of 1. Each galaxy was color-coded by its respective b value (Teklu et al. 2015) with the classification scheme from Schulze et al. (2020; red: elliptical, green: intermediate, blue: disk). Galaxies clustered at logsSFR = −12 were given a SFR estimate based on the Weinmann et al. (2010) approach (see text).
Current usage metrics show cumulative count of Article Views (full-text article views including HTML views, PDF and ePub downloads, according to the available data) and Abstracts Views on Vision4Press platform.
Data correspond to usage on the plateform after 2015. The current usage metrics is available 48-96 hours after online publication and is updated daily on week days.
Initial download of the metrics may take a while.