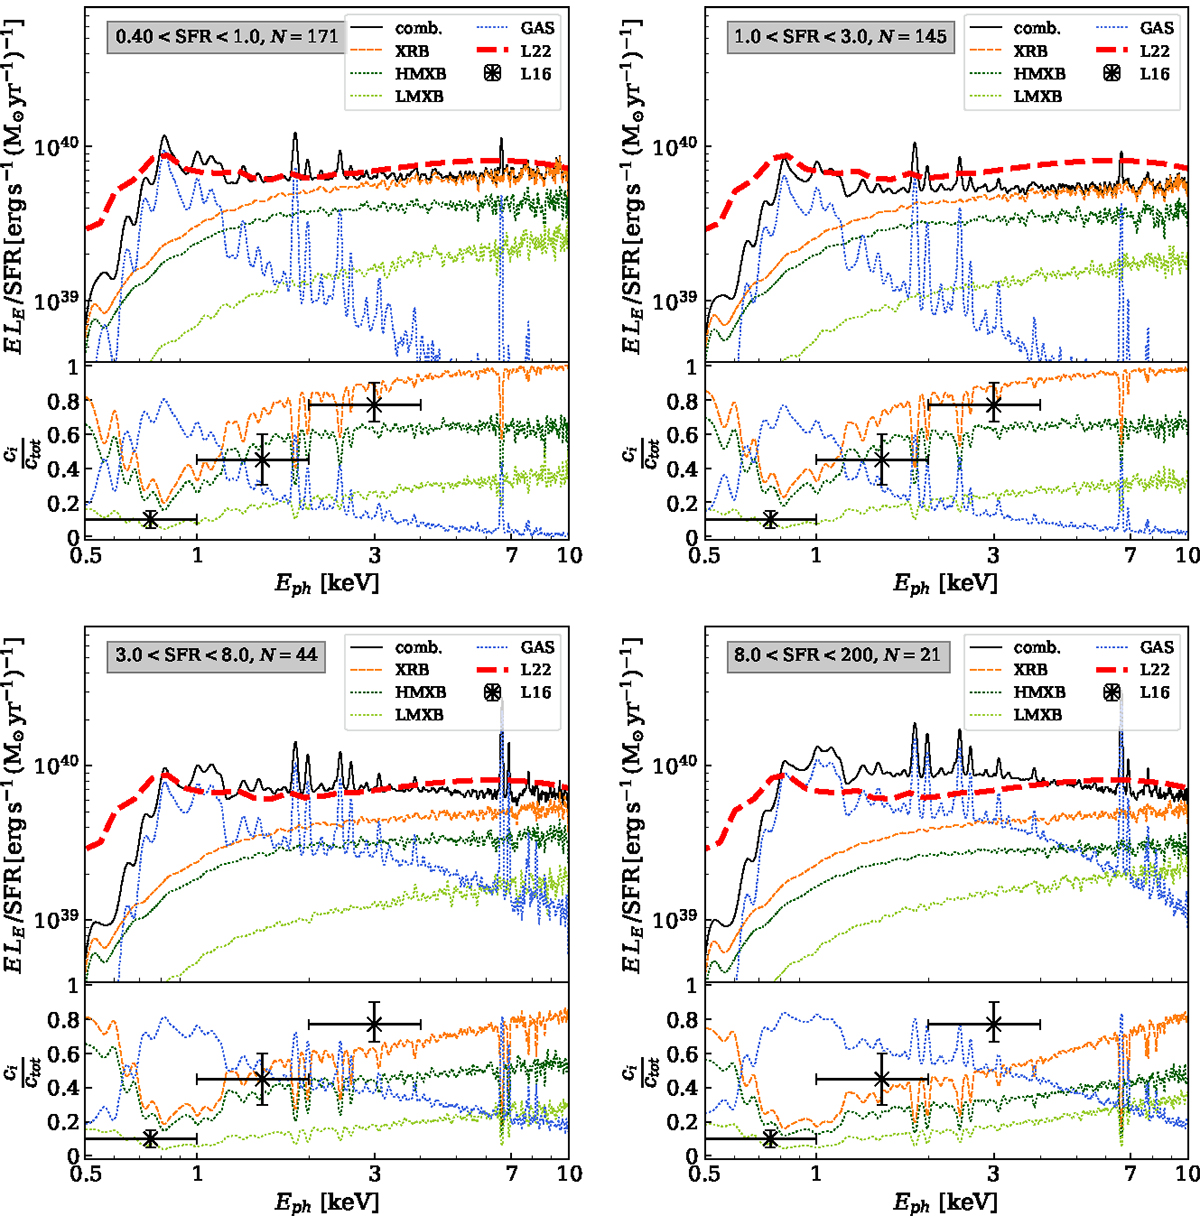
Fig. 13.
Download original image
Mean X-ray spectrum (solid black) of our star-forming galaxy sample binned by SFR from lowest (upper left panel) to highest (bottom right) in the energy range 0.5–10 keV. The mean spectrum was calculated by normalizing each galaxy spectrum to its total 0.5–10 keV emission and taking the average in each energy bin. Dotted lines represent the different components that contribute to the total spectrum: hot gas emission (blue), LMXB (lime green), and HMXB (dark green). “XRB” (orange) stands for LMXB+HMXB emission. The red line is the L22 average spectrum derived from observations of dwarf galaxies. The lower part of each panel shows the fractional contribution of each component to the mean spectrum together with the XRB count ratios from L16. The gray box highlights the bin size and the number of galaxies, N, within each bin.
Current usage metrics show cumulative count of Article Views (full-text article views including HTML views, PDF and ePub downloads, according to the available data) and Abstracts Views on Vision4Press platform.
Data correspond to usage on the plateform after 2015. The current usage metrics is available 48-96 hours after online publication and is updated daily on week days.
Initial download of the metrics may take a while.