Fig. 11.
Download original image
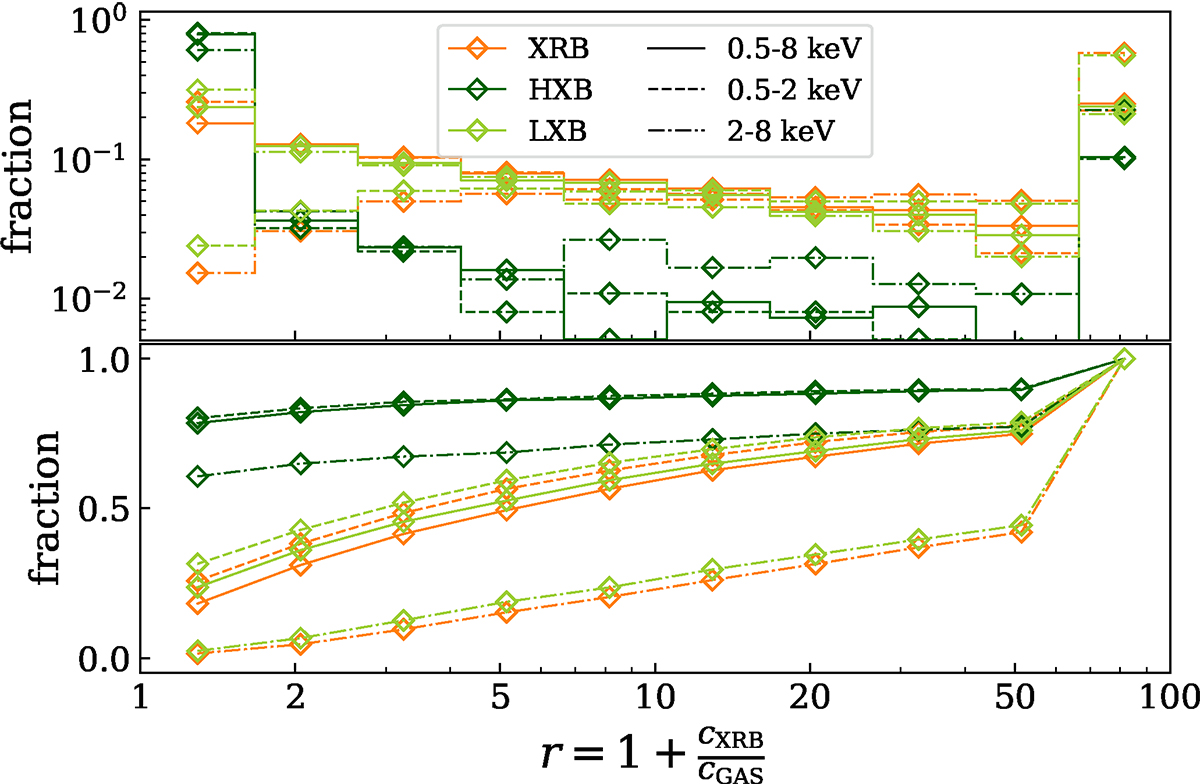
X-ray photon count ratio between the XRB and the hot gas component including all galaxies in our sample. Colors represent the component and line styles the energy range in the observed frame. The label “XRB” shows the sum of HMXB and LMXB emission. Top: differential fraction of galaxies with a given count ratio, r. Bottom: cumulative fraction of galaxies. Here, a ratio of r ≥ 2 means that the XRB component is dominant. Ratios exceeding the given range are collected in the last bin.
Current usage metrics show cumulative count of Article Views (full-text article views including HTML views, PDF and ePub downloads, according to the available data) and Abstracts Views on Vision4Press platform.
Data correspond to usage on the plateform after 2015. The current usage metrics is available 48-96 hours after online publication and is updated daily on week days.
Initial download of the metrics may take a while.