Open Access
Fig. 3.
Download original image
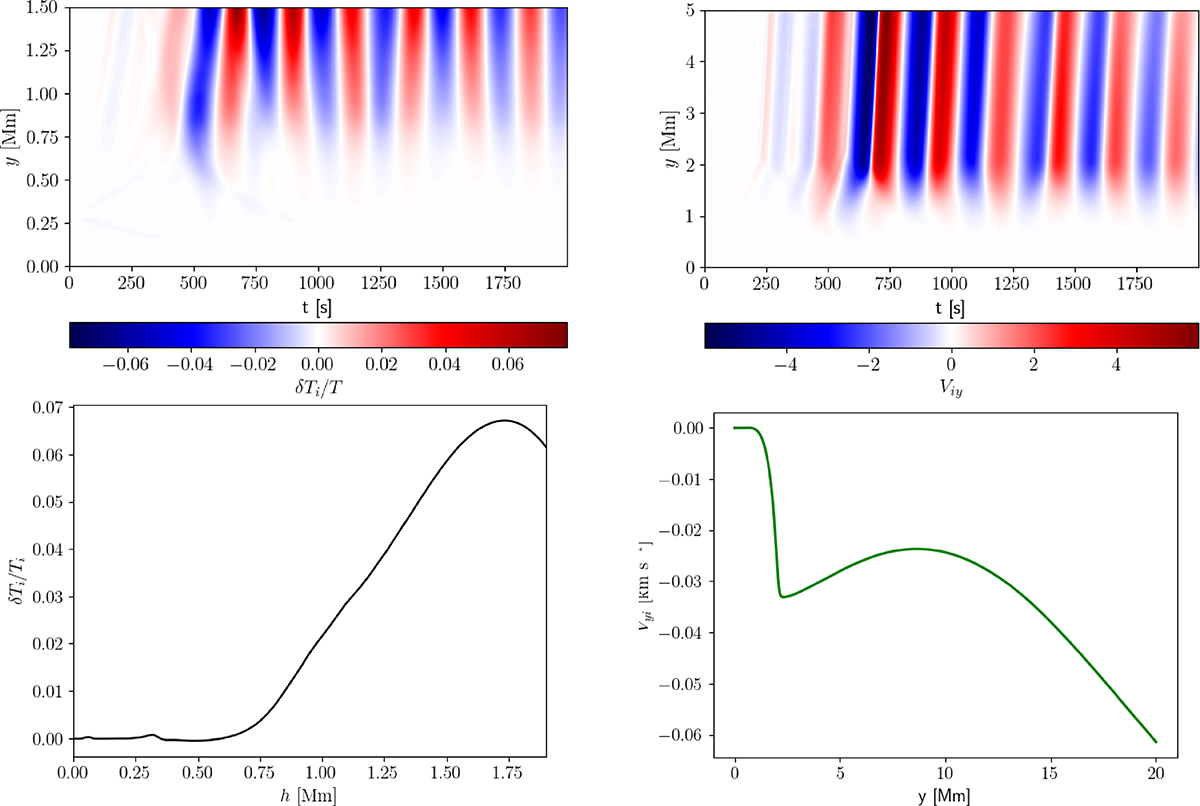
Time-distance plots for δTie/T (top left), and Viy (top right) and vertical profiles of ⟨δTie/T⟩t (bottom left) and ⟨Viy⟩t (bottom right), both averaged over time, in the case of B0y = 30, B0z = 5 G, y0 = 0.3 Mm, w = 0.1 Mm, and A = 1 km s−1.
Current usage metrics show cumulative count of Article Views (full-text article views including HTML views, PDF and ePub downloads, according to the available data) and Abstracts Views on Vision4Press platform.
Data correspond to usage on the plateform after 2015. The current usage metrics is available 48-96 hours after online publication and is updated daily on week days.
Initial download of the metrics may take a while.