Fig. A.2.
Download original image
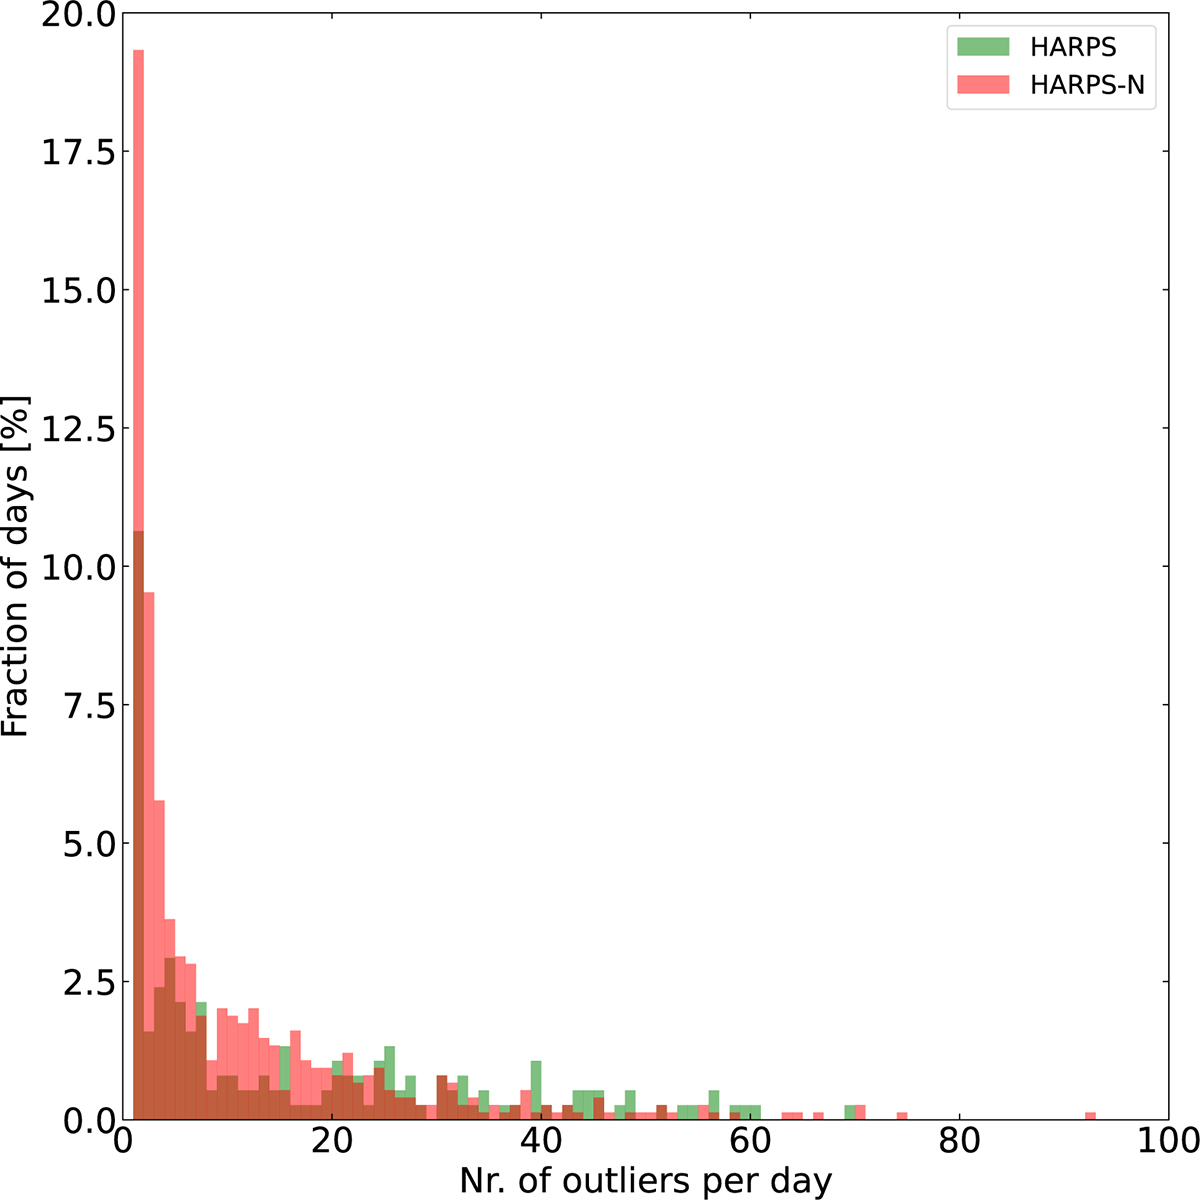
Outlier statistics. The histograms show the distribution of the number of outliers, i.e., points with a quality flag < 0.9, per day for HARPS (green) and HARPS-N (red). The histograms are binned between one and 100 outliers per day in steps of one. The fraction of days is relative to the number of days observed with each instrument. For HARPS and HARPS-N, 47.3% and 76.1%, respectively, of all observed days have at least one outlier.
Current usage metrics show cumulative count of Article Views (full-text article views including HTML views, PDF and ePub downloads, according to the available data) and Abstracts Views on Vision4Press platform.
Data correspond to usage on the plateform after 2015. The current usage metrics is available 48-96 hours after online publication and is updated daily on week days.
Initial download of the metrics may take a while.