Fig. 6.
Download original image
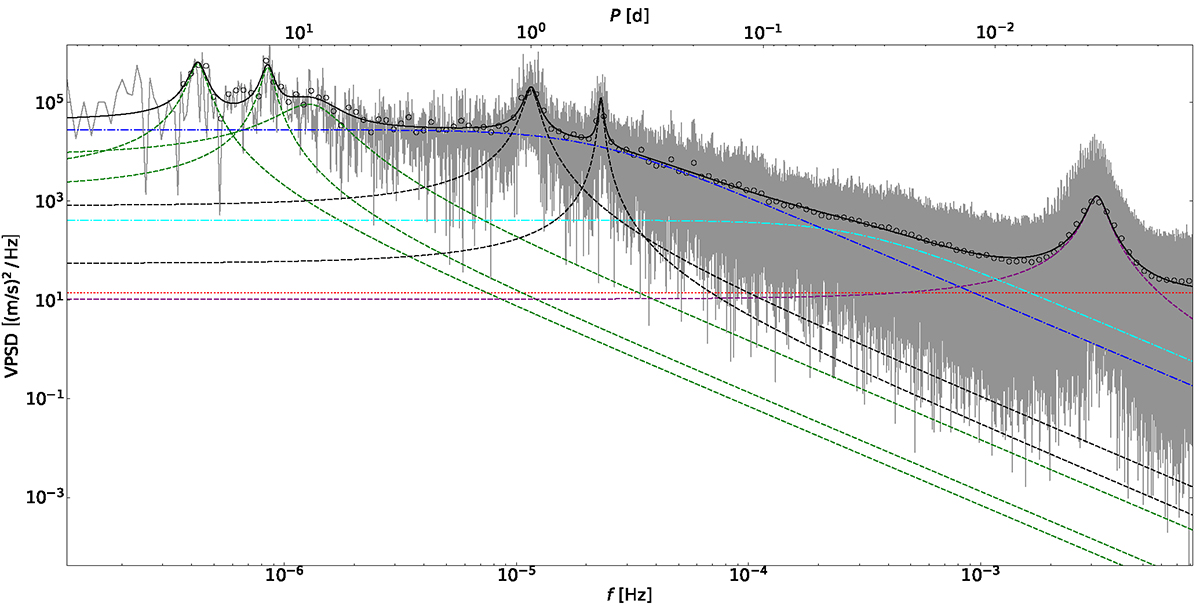
Stellar signal components fitted to the combined HARPS and HARPS-N VPSD (solid gray curve). The dotted red curve shows the photon-noise constant. The dashed curves represent Lorentzian functions for oscillations (purple), rotation and its harmonics (green), and aliases (black), whereas dash-dotted curves represent Harvey functions for granulation (cyan) and supergranulation (blue). The solid black curve is the sum of all components, which was fitted with respect to the binned VPSD (black circles).
Current usage metrics show cumulative count of Article Views (full-text article views including HTML views, PDF and ePub downloads, according to the available data) and Abstracts Views on Vision4Press platform.
Data correspond to usage on the plateform after 2015. The current usage metrics is available 48-96 hours after online publication and is updated daily on week days.
Initial download of the metrics may take a while.