Open Access
Fig. 5.
Download original image
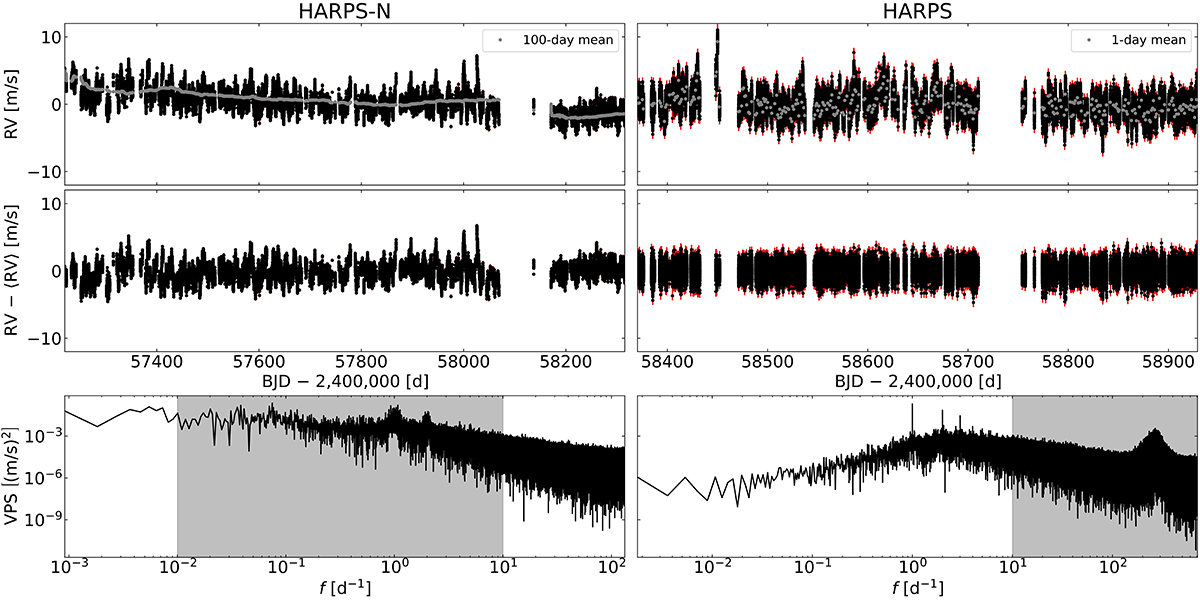
Total RV time series and VPS for HARPS and HARPS-N. Top: radial velocity time series. Middle: HARPS-N RVs detrended by a 100-day rolling mean, and HARPS RVs detrended by a weighted daily mean. Bottom: generalized Lomb-Scargle periodogram where the gray regions are merged together.
Current usage metrics show cumulative count of Article Views (full-text article views including HTML views, PDF and ePub downloads, according to the available data) and Abstracts Views on Vision4Press platform.
Data correspond to usage on the plateform after 2015. The current usage metrics is available 48-96 hours after online publication and is updated daily on week days.
Initial download of the metrics may take a while.