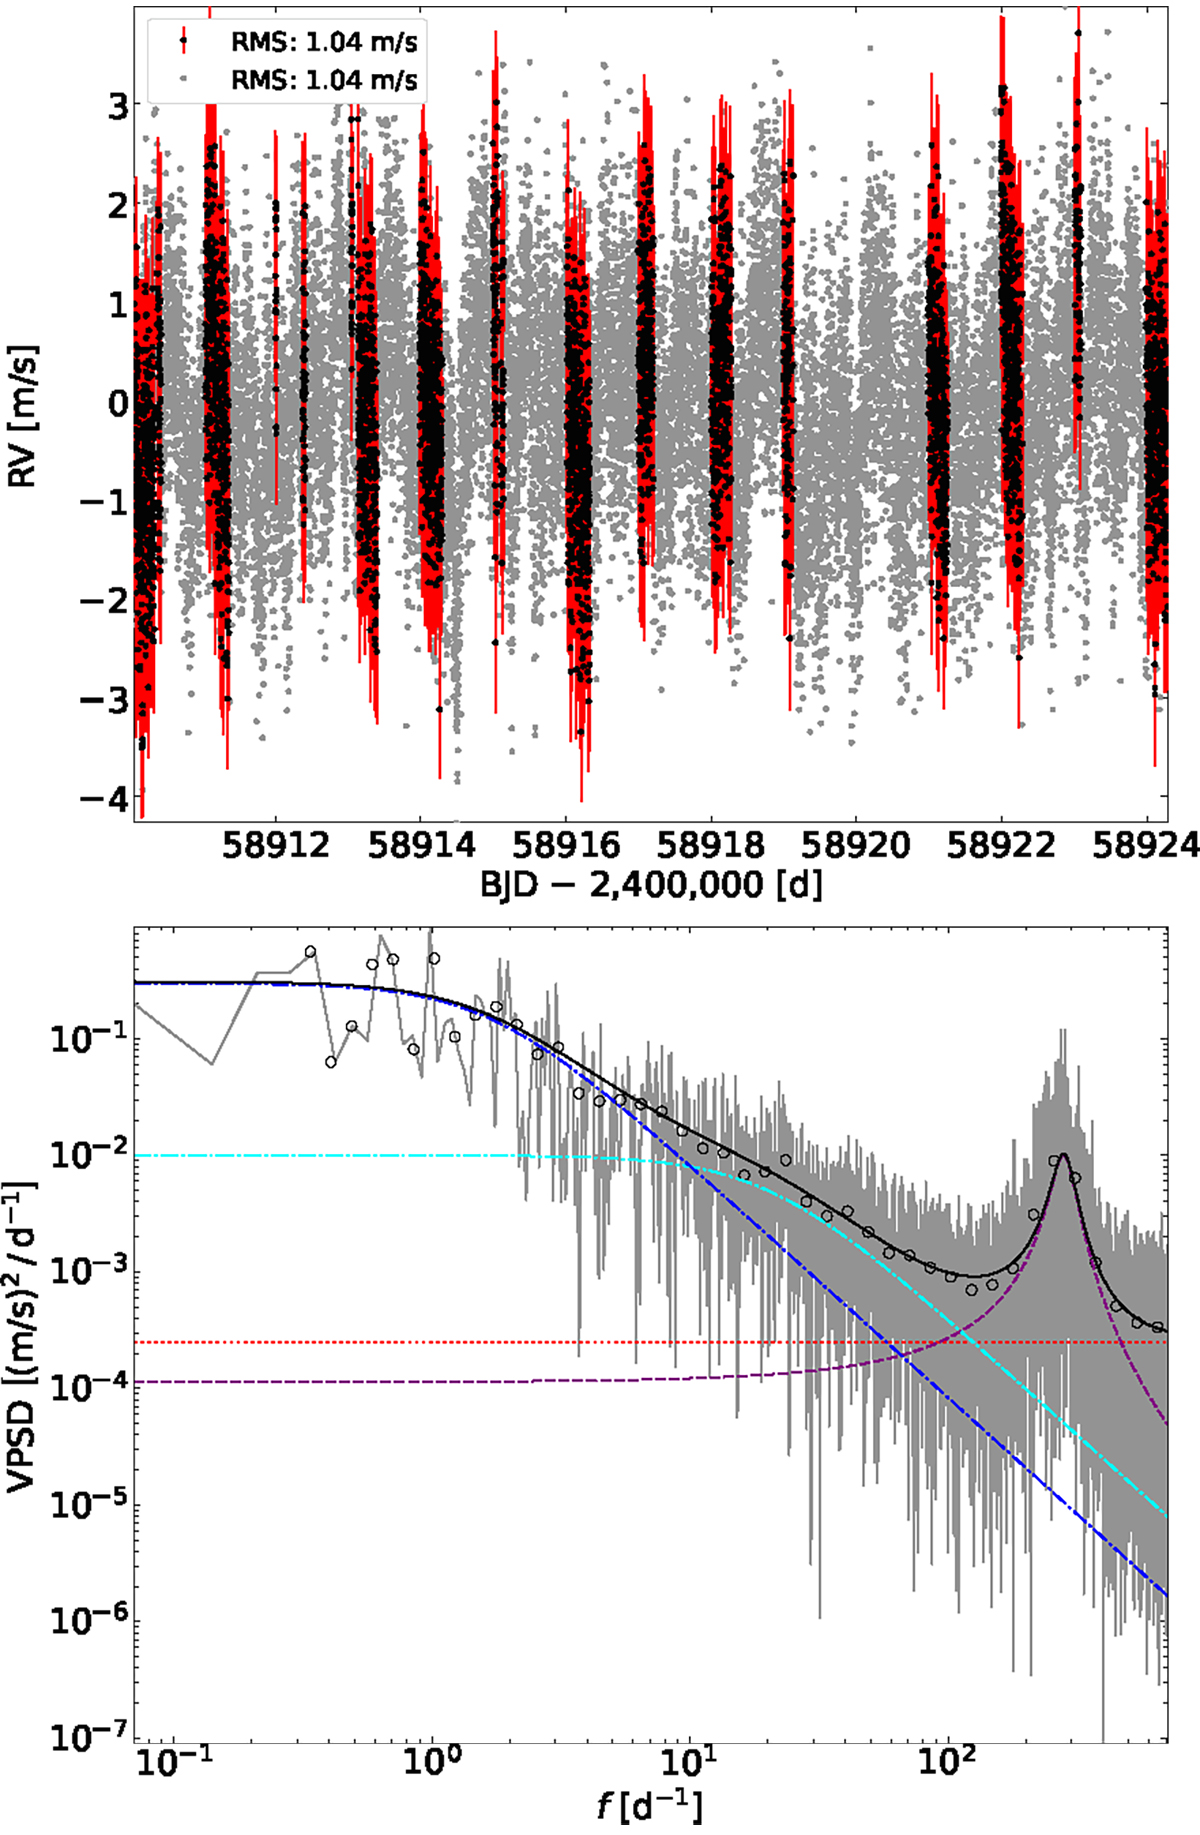
Fig. 4.
Download original image
HARPS RVs and VPSD between March 1 and 15, 2019. Top panel: HARPS RVs for which the sub-rotational components are analyzed. The original observations are shown as black dots with red error bars. The RVs recreated from the sum of all fitted VPSD components on an even time grid with the same cadence and end points as the observations are shown in gray. Bottom panel: velocity power spectral density of the observed RVs (in gray) and the modeled components (colored curves), consisting of photon noise (dotted red), oscillations (dashed purple), granulation (dash-dotted cyan) and supergranulation (dash-dotted blue). The sum of the models (solid black) is optimized with respect to the black circles, which correspond to the true VPSD averaged on logarithmically equidistant frequency steps.
Current usage metrics show cumulative count of Article Views (full-text article views including HTML views, PDF and ePub downloads, according to the available data) and Abstracts Views on Vision4Press platform.
Data correspond to usage on the plateform after 2015. The current usage metrics is available 48-96 hours after online publication and is updated daily on week days.
Initial download of the metrics may take a while.