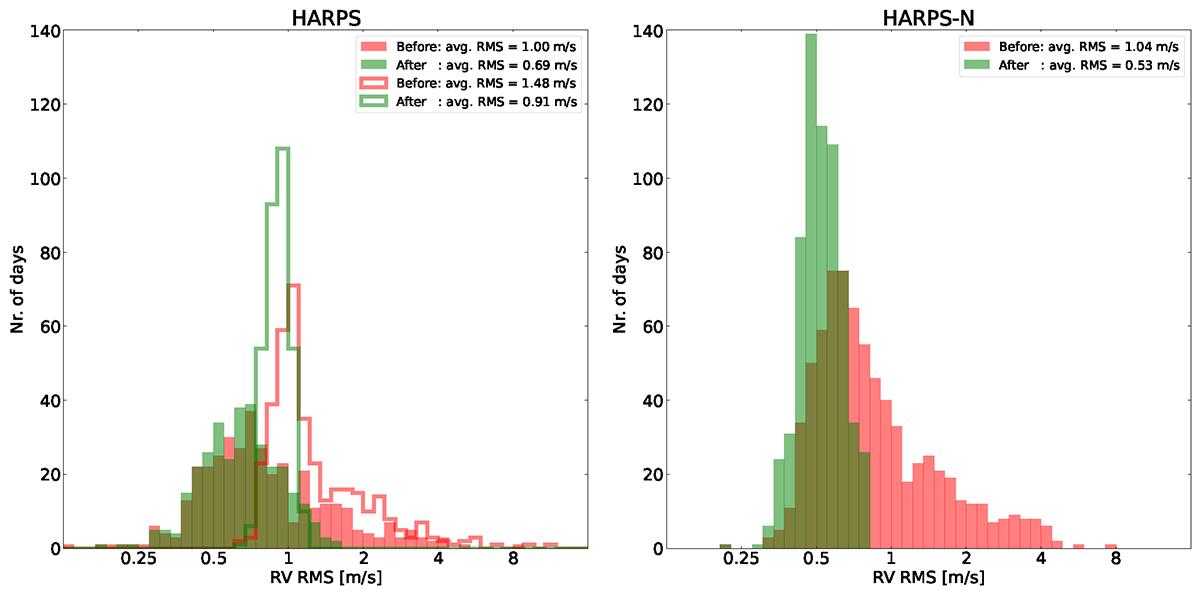
Fig. 3.
Download original image
Improvement of daily RV rms for HARPS (left panel) and HARPS-N (right panel). The histograms show the distribution of intraday rms scatter before (in red) and after (in green) removing points with quality flags < 0.9 and correcting for differential extinction with the fitted airmass-magnitude line parameters. For HARPS, we also binned the data every 5.5 min to equal the sampling of HARPS-N data and with it we averaged out the signal induced by stellar oscillations; the rms values of the binned HARPS data are shown in the fully colored histograms, and the rms values of the unbinned HARPS data are shown in the step histograms. The legend displays the average rms for the different distributions. Days with fewer than ten measurements remaining after imposing the quality flag threshold were rejected. For HARPS, the number of included days decreased from 376 to 326; for HARPS-N, the number of included days decreased from 745 to 644.
Current usage metrics show cumulative count of Article Views (full-text article views including HTML views, PDF and ePub downloads, according to the available data) and Abstracts Views on Vision4Press platform.
Data correspond to usage on the plateform after 2015. The current usage metrics is available 48-96 hours after online publication and is updated daily on week days.
Initial download of the metrics may take a while.