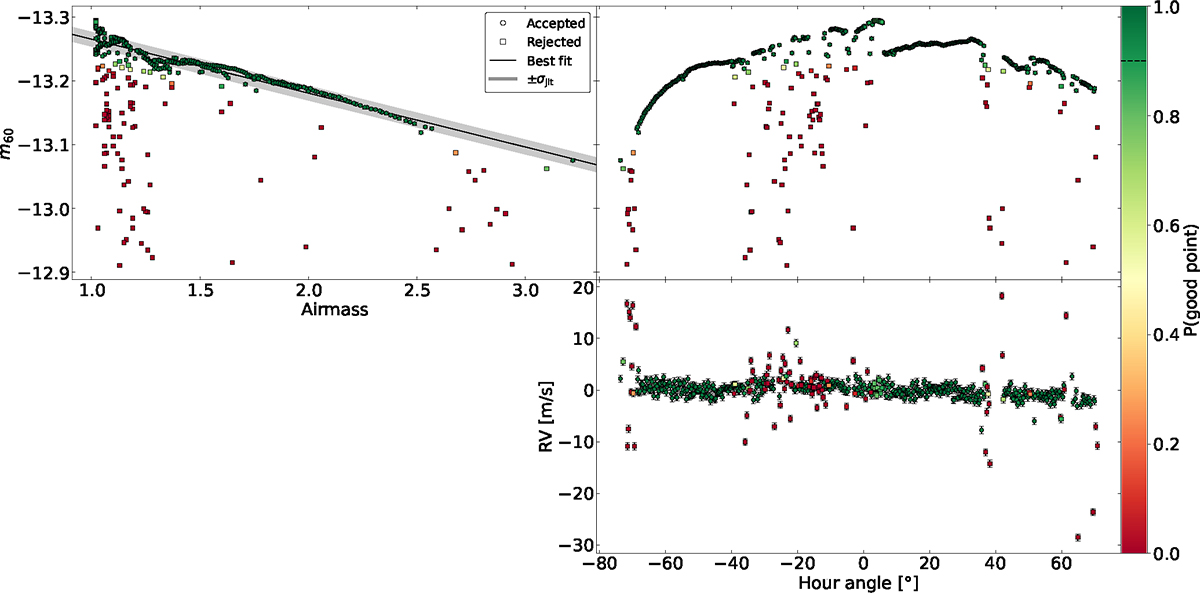
Fig. 2.
Download original image
Example of quality assessment for HARPS observations taken on November 11, 2019. Top panels: 60th spectral order magnitude, m60, as a function of airmass (left) and hour angle (right). The black line and gray area show the best fit and ±1σ interval for the estimated jitter. Data points are color-coded with their assessed quality shown in the colorbar. Points with a quality flag > 0.9 are accepted (circles), and the rest are rejected (squares). The magnitude error bars are smaller than the markers. Bottom panel: radial velocity as a function of hour angle. It should be noted that the displayed RVs are still uncorrected for differential extinction.
Current usage metrics show cumulative count of Article Views (full-text article views including HTML views, PDF and ePub downloads, according to the available data) and Abstracts Views on Vision4Press platform.
Data correspond to usage on the plateform after 2015. The current usage metrics is available 48-96 hours after online publication and is updated daily on week days.
Initial download of the metrics may take a while.