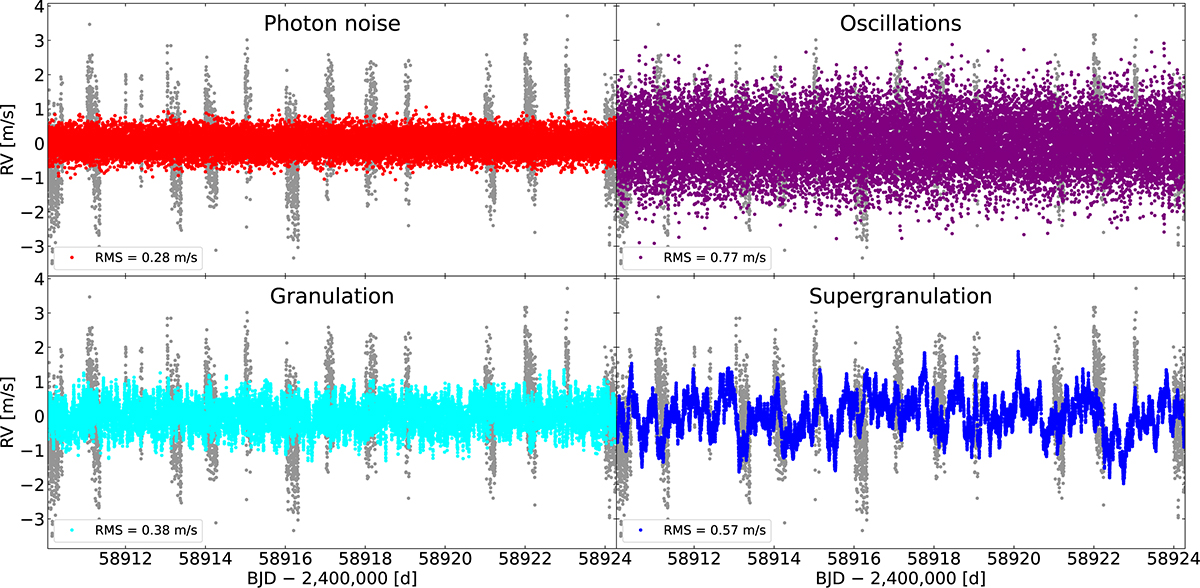
Fig. B.1.
Download original image
Recreated RV components on sub-rotational timescales. Individual RV contributions are from the stellar signals fitted in the VPSD of Fig. 4. The components are indicated in the top of each subplot and the RV points are color-coded according to the curve colors in Fig. 4. The rms of each component is shown in the lower left legend in each subplot. The true total signal (without error bars) is shown in gray for comparison.
Current usage metrics show cumulative count of Article Views (full-text article views including HTML views, PDF and ePub downloads, according to the available data) and Abstracts Views on Vision4Press platform.
Data correspond to usage on the plateform after 2015. The current usage metrics is available 48-96 hours after online publication and is updated daily on week days.
Initial download of the metrics may take a while.