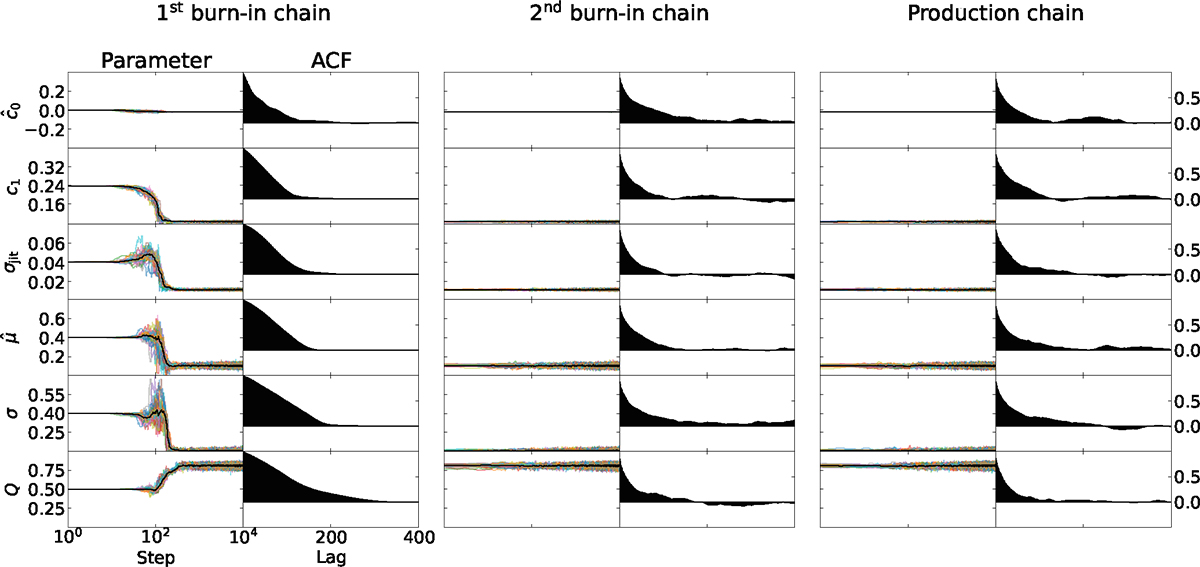
Fig. 1.
Download original image
Example of MCMC parameter chains for HARPS observations taken on November 11, 2019. The grouped columns represent the first burn-in chain (left), the second burn-in chain (middle), and the production chain (right), respectively. The left panels in each column show the sampled parameter values at each iterated step, where each colored line represent one walker and the black line represents the median of all 32 walkers. The parameter axis limits are set equal to the bounds of their uniform prior distributions (see Table 1). The right panels of each column show the ACF up to a lag of 400 steps.
Current usage metrics show cumulative count of Article Views (full-text article views including HTML views, PDF and ePub downloads, according to the available data) and Abstracts Views on Vision4Press platform.
Data correspond to usage on the plateform after 2015. The current usage metrics is available 48-96 hours after online publication and is updated daily on week days.
Initial download of the metrics may take a while.