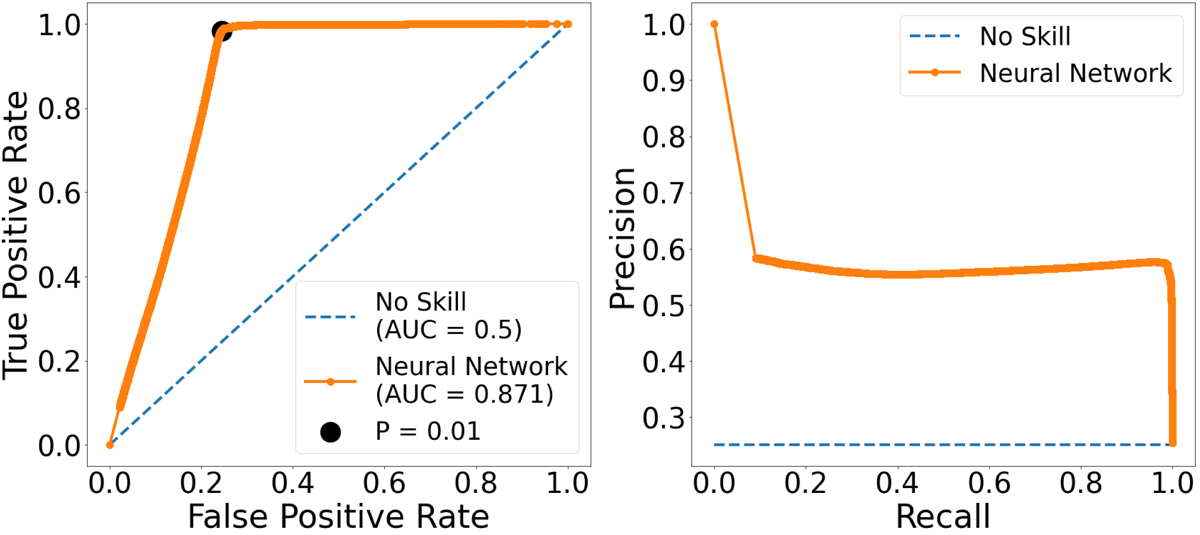
Fig. 8.
Download original image
Evaluation metrics for the Neural Network classifier performance using the StarHorse sample. Left: ROC curve. Black dot is in the “elbow” of the ROC curve and it shows the best balance between completeness and purity. Right: precision-recall curve. In both cases, we compare our model (orange solid curve) with a classifier that has no class separation capacity (blue dashed curve).
Current usage metrics show cumulative count of Article Views (full-text article views including HTML views, PDF and ePub downloads, according to the available data) and Abstracts Views on Vision4Press platform.
Data correspond to usage on the plateform after 2015. The current usage metrics is available 48-96 hours after online publication and is updated daily on week days.
Initial download of the metrics may take a while.